Sally Brown
King County, Washington has a great biosolids program. It produces a Class B cake that is used to fertilize dryland wheat fields and commercial forests. A very small portion of the biosolids produced (<1%) has been composted by a private company. That company is shutting down and the County is working to start its own biosolids composting facility.
With its current program, King County racks up the carbon credits. Replicated field plots in the dryland wheat fields have shown that a high portion of the carbon added with the biosolids stays in the soil. Soil carbon storage and credits for fertilizer avoidance more than offset emissions from the >400 mile round trip haul. A local King County composting facility will reduce transport distance and so cut emissions that way. But what credits/debits (offsets vs. emissions) would result from local use of the compost? This article runs through the variables and the application scenarios.
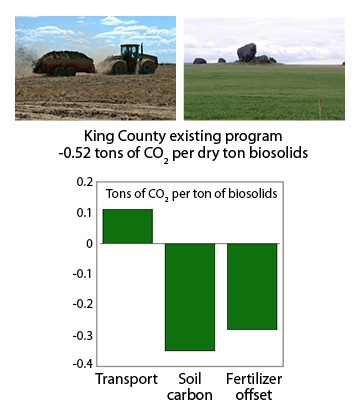
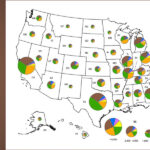
Carbon emissions vs. reductions of King County’s current biosolids program looks like this (see figure to right):
Even though the haul distance to dryland wheat fields is very high, the county’s biosolids are transported using high capacity vehicles, lowering the per ton carbon footprint associated with transport. Application to poor soils has shown high rates of soil C sequestration — -0.52 tons of CO2/dry ton of biosolids.
Urban Compost Use Variables
To find out what credits/debits would result from local use of compost produced locally by the county, we modeled likely rates of carbon sequestration for urban uses of compost. The peer review literature was used to estimate carbon debits/credits for growing lawns, trees, urban agriculture and for use alongside urban roadways.
Pickup Vs. Delivery
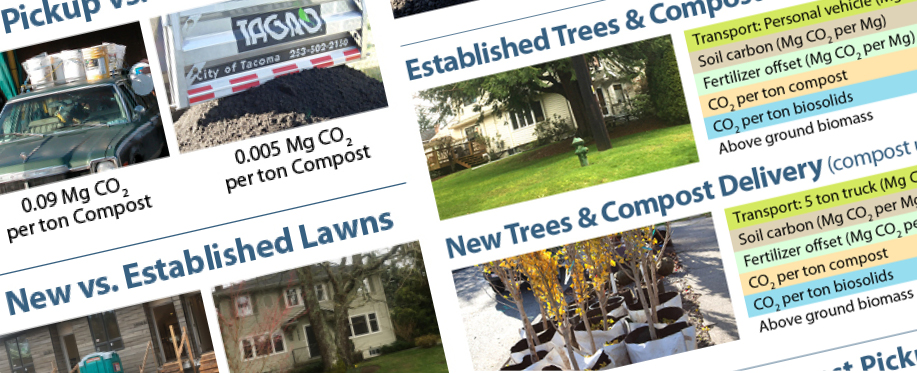
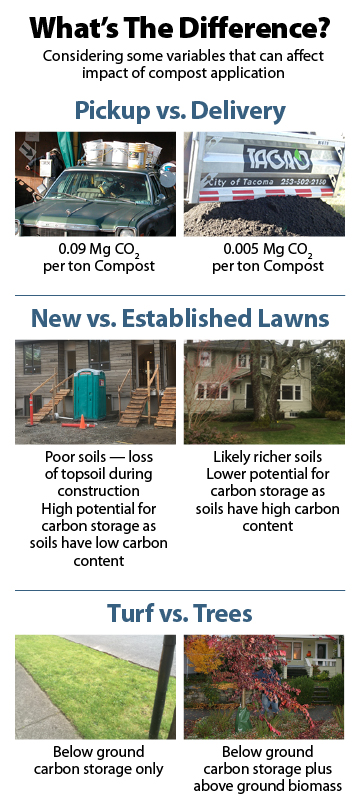
Transport in urban areas is much less efficient than long haul trucking. Using your own car is a worst-case scenario. Even though individual driving distances are short (12 miles round trip in our scenarios) the number of cars required to carry a dry ton of compost makes these emissions add up. Using a car to pick up 50 kg (110 lbs) of compost generates 0.09 Mg CO2/ton of compost. Delivery, on the other hand, is 0.005 Mg CO2/ton of compost, as each dump truck load holds 5 tons of compost. (Note: 1 Mg=1 ton)
Lawns
While urban soils are generally stereotyped as being low quality, many urban lawns and gardens are actually very healthy, having been well tended for decades. For example, new lawns likely have poor soils, in part due to loss of topsoil during construction. Therefore they have a high potential for carbon storage as the soils have low carbon content. Conversely, established lawns likely have richer soils and high carbon content, thus have lower potential for carbon storage.
Turf and Trees
The underlying soils for both lawns and trees will respond to compost addition and store carbon. However, because trees tend to live for decades, the carbon in the tree trunk and branches also counts as carbon storage. For turf, you get credits for soil carbon and not using fertilizer. For trees, you get those same credits plus an additional credit for above ground biomass. Growing trees, particularly in a high productivity area like the Pacific Northwest, means a high rate of above ground biomass carbon storage.
Running The Numbers — Impact On The Offset
Results from specific end uses are shown in the series of tables below. They highlight the good and the bad, where applicable. While the comparisons for this column were done with a focus on compost use in King County, the results are applicable for other cities as well. Carbon credits/debits were estimated both on a per ton of compost basis and a per ton of biosolids basis.
To put the findings for the compost basis vs. the biosolids basis into perspective, it is important to consider the quantity of biosolids in a dry ton of compost. Here, we considered compost feedstocks to consist of a 3:1 by volume mixture of yard trimmings and municipal biosolids. We estimated a 45% solids content and a wet bulk density of 470kg m3 for yard trimmings (Andrew Bary, Washington State University, personal communication). For biosolids, we considered the density to be equal to water and assumed a solid content of 25%. This would make a feedstock combination that was about 30% biosolids on a dry weight basis. Assuming that an equal percentage of the yard trimmings and biosolids would decompose (50%) during composting, the final compost would also be 30% biosolids. While we based this study on King County’s Loop biosolids program, results would apply to other feedstocks that are used to produce nutrient rich composts.
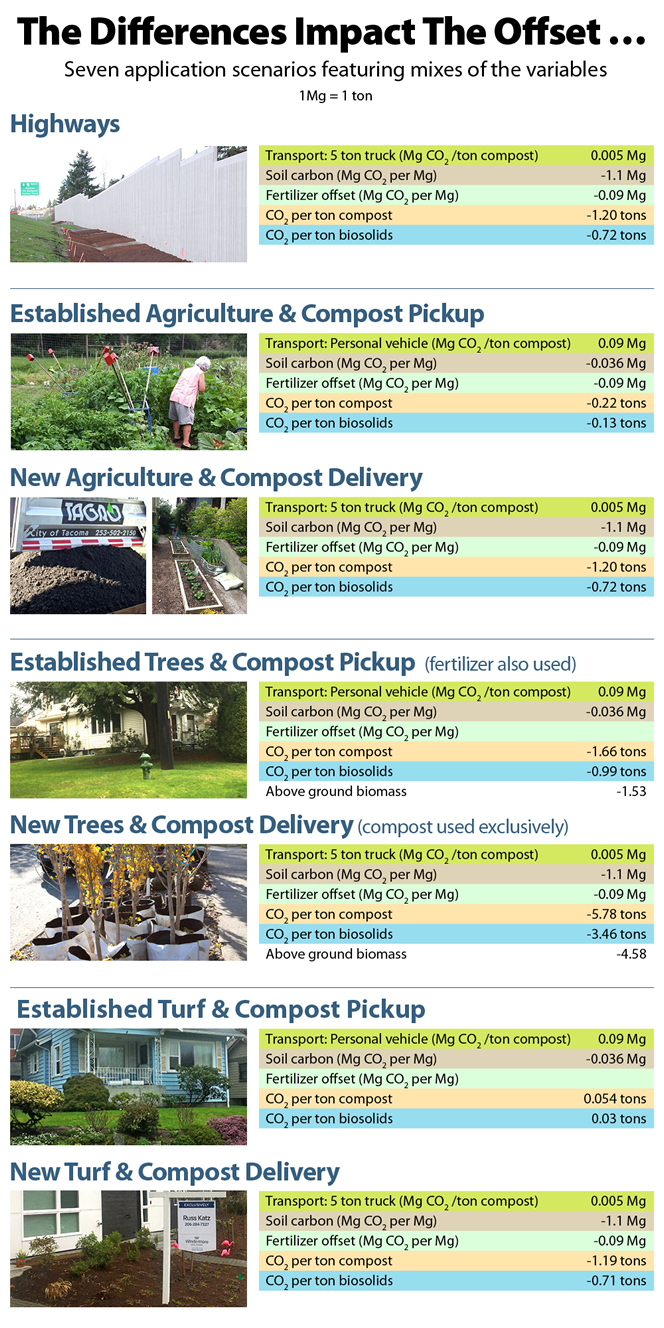
Here are the carbon credits/debits using 7 application scenarios. Each features mixes of the variables.
What’s It All Mean?
It turns out that using compost in urban areas can sequester a lot of carbon — especially if you use it on poor soils to grow trees. Use for turf in new home construction or urban agriculture is also very carbon friendly. Greening up your highways can provide lots of carbon credits.
However, your most loyal customer is likely the worst case for carbon storage. Well-tended soils already have high organic matter with little room for additional carbon sequestration. If that customer picks up the compost in their personal vehicle and uses fertilizer just to make sure, compost is just over the line of neutrality — you get minimal net emissions.
In all probability, the compost that King County will make will go to a variety of end uses with the net carbon balance somewhere in the middle of these examples. Remember too that benefits of compost are not limited to carbon credits. Having a locally available compost product made from local ingredients will make the city greener, enhance environmental awareness and may even save the County a few dollars per ton.
Sally Brown, BioCycle’s Senior Adviser and long-time Connections columnist, is a Research Professor in the College of the Environment at the University of Washington.


