Craig Coker
One method of comparing alternatives such as site development costs for one site versus another, or for one model of specific equipment versus another, is to compute the Net Present Value (NPV) of each alternative over the expected life of the alternatives. To keep the math simpler, I normally use a 10-year economic life. These analyses are relatively simple with an Excel spreadsheet.
NPV analyses are often used in financial investment analyses as they model cash flows in and out over the anticipated life of the investment. In engineered facility projects, they can be used to model only the outgoing cash flow of several alternatives, provided all alternatives have the same economic life and produce the same quantities of outputs. The calculation includes initial capital cost, capital costs of replacements during the modeled economic life, operating costs inflated by the Congressional Budget Office inflation forecast, and avoided costs (if any).
These costs are then expressed in current dollar terms using a discount factor equal to the average weighted cost of equity vs. debt capital (for municipal projects, the bond rate for the municipality can be used). If these assumptions hold true, then the alternative with the least NPV is the best financial alternative. Alternatives with less than a 10% difference between them are considered financially equal at this level of analysis.
Case Studies
Composting Method Analysis
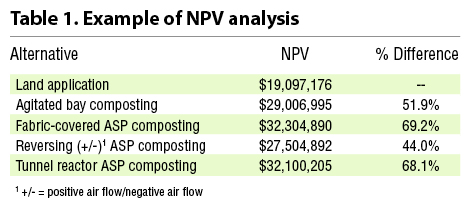
Table 1 compares several alternatives for a 24,000 tons/year biosolids composting facility using different composting approaches versus its current land application program in a northern Midwest state.
See “Economic Tool To Evaluate Organics Recycling Options”, December 2015 for a more in-depth discussion.
Cash Flow Forecasts
Anyone in business for any length of time knows that cash flow dominates everything, especially in start-ups and young businesses. These analyses are also relatively simple with an Excel spreadsheet. These forecasts are often called “pro formas,” a Latin term that means “for the sake of form” or “as a matter of form.”
Pro forma cash flow forecasts are set up on a monthly basis, usually over a 3-year period, so that investors can see whether possible investments have been really thought through as to how cash will flow into, and out of, the business. On the revenue side, tip fees (also hauling fees) are estimated on the basis of anticipated tonnages and on when those tonnages will be realized. Each month’s forecast could be based on that month’s relative percentage of annual incoming tonnages.
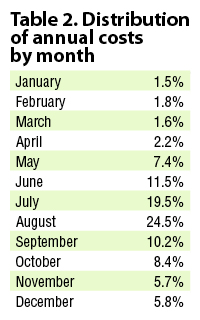
Table 2 shows the monthly distribution of incoming yard trimmings at a Northeastern food waste composting facility with a large summer tourist season (clearly, these distributions will vary widely among composting facilities). Revenues from product sales are forecasted as follows: monthly sales distributions (see Part I of this series) times expected compost production times expected market share. Be conservative at first (say 5% to 10%), anticipating growth over time to say, 30% to 35%.
Monthly costs are computed by taking the operating cost projection (or estimate) times the monthly percentage of incoming tonnages. Table 3 shows a projected cash flow pro forma from a proposed 10,000 tons/year municipal yard trimmings composting facility.
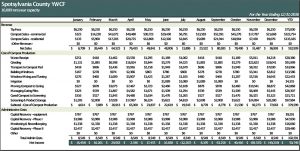
Table 3. Projected cash flow pro forma from a proposed 10,000 tons/year municipal yard trimmings composting facility
The municipality was able to use the information developed in the pro formas to evaluate the budgetary impact of the proposed project. It also aided in understanding the fiscal impacts to the project’s financial performance when deciding to let citizens bring in yard trimmings without a tip fee for the project’s first phase.
Craig Coker is a Senior Editor at BioCycle and CEO of Coker Composting & Consulting near Roanoke, VA.


