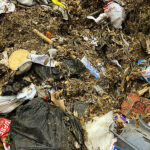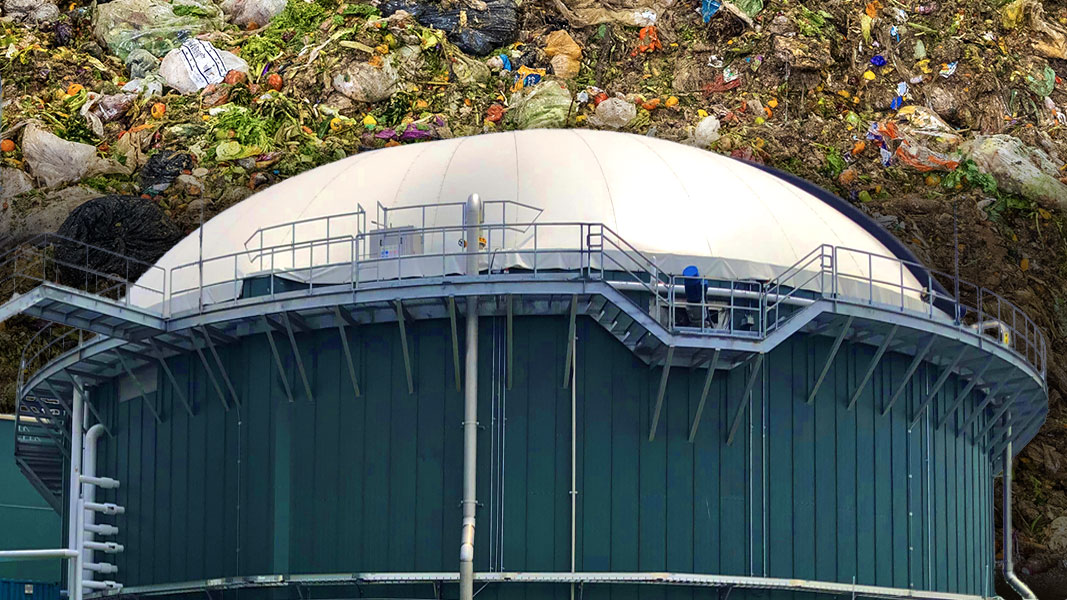
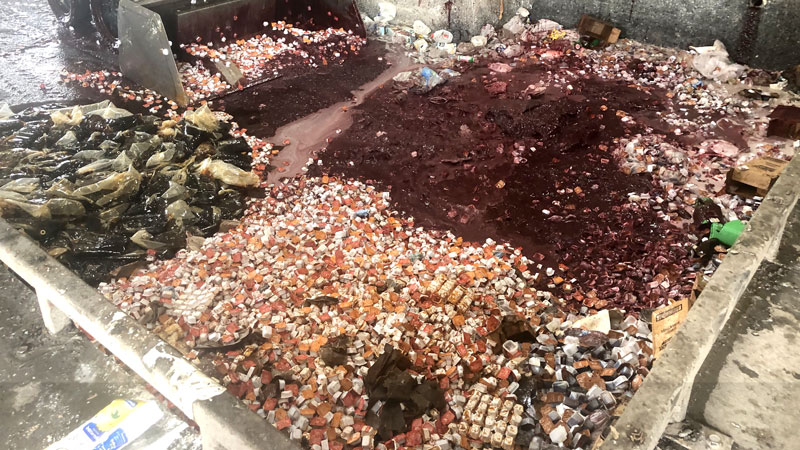
Top: Bioenergy Devco stand-alone food waste digester in Jessup, MD (center); food waste on tip floor at WM CORe preprocessing facility in Brooklyn, NY (top). Photos courtesy Paul Greene and NYC Department of Environmental Protection
Nora Goldstein
The U.S. Environmental Protection Agency has been surveying operators of anaerobic digesters that process pre and postconsumer food waste streams since 2017. Recently, the agency released the findings for Calendar Years (CY) 2020 and 2021. It also is distributing the final survey now (responses are due by August 5, 2024) and will conduct data verification and analysis before closing out the anaerobic digestion data collection project in 2025.
EPA surveys three types of facilities:
- Stand-alone food waste digesters: Stand-alone digesters typically accept and process feedstocks from one or more sources for a tipping fee. Other stand-alone digesters are built to manage a certain type of material for a specific business. These digesters can process yard trimmings, manures, and wastewater solids, but the primary feedstock is usually food waste.
- On-farm digesters that codigest food waste: Anaerobic digesters on farms are designed to process manure. However, many farms also accept and process other organic wastes from offsite, including food waste.
- Digesters at water resource recovery facilities (WRRF) that codigest food waste: Anaerobic digesters at WRRFs are designed to process wastewater solids. However, many also accept and process other organic wastes from offsite, including food waste.
EPA provided the 2023 survey directly to 310 facilities believed to be operational and for which EPA had contact information. EPA also posted the survey on its AD website. The agency received responses from 51 operational and four non-operational facilities across 22 states. The four non-operational facilities were in the planning, design, or permitting stage, temporarily shut down, or permanently closed. Not all facilities responded to all questions. The number of respondents to EPA’s surveys for the data years requested (2015-2021) has declined, from 137 responses reporting 2015 operational data to 41 in 2021. However, notes EPA, “the number of identified AD facilities processing food waste in the U.S. has increased steadily since the beginning of the AD Data Collection Project, from 154 in 2017 to 310 in 2023 (and 310 is likely an undercount).” The most recent findings are captured below in excerpts from the report EPA released in June 2024.
2020, 2021 Data
The survey of anaerobic digestion (AD) facilities completed in 2023 collected the following data for 2020 and 2021: Amount of food waste and non-food waste processed; Feedstock types and sources; Amount of biogas produced; and Information about tipping fees. Other data collected reflect circumstances at the time of the survey, including operational dates and operational status, operational specifications, biogas use, and digestate treatment and use. All data were voluntarily submitted by survey respondents and were aggregated and checked for quality before publication, states EPA. The states with the most operational anaerobic digesters returning survey responses were California (13), Iowa (4), and New York (4).
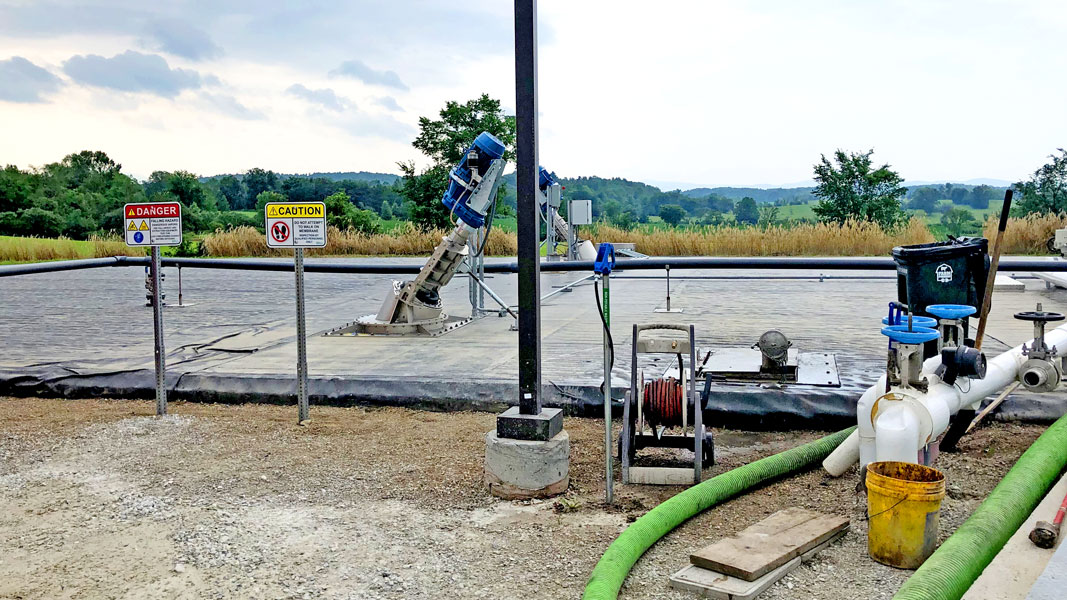
Incoming food waste hydrolyzer tank at Goodrich Family Farm in Salisbury, Vermont. Photo by Nora Goldstein
Food waste is grouped into nine categories: Beverage processing (e.g., liquid wastes from brewing beer); Fats, oils and greases (e.g., used cooking oils); Food processing; Pre and postconsumer foodservice (e.g., kitchen scraps or uneaten plate waste); Fruits/vegetative; Retail (e.g., unsold food from grocery stores); Slaughterhouse; Source separated commercial, institutional or residential organics; and Other food waste. Tables reporting quantities from each category in CY 2020 and 2021 are available on a supplemental data page. Where facilities reported their food waste processing amounts in gallons, EPA used conversion factors appropriate for each feedstock to convert gallons to tonnages before calculating the total amount of food waste processed each year.
Based on data submitted by 39 survey respondents, and EPA’s conversions where necessary, the total amount of food waste processed in all three digester types in 2020 was over 15.8 million tons. In 2021, 41 respondents processed over 16.8 million tons of food waste. Beverage processing waste at stand-alone digesters comprised the majority of food waste processed in 2020 and 2021 (Table 1). This is due to several factors, explains EPA:
- Beverage processing waste has a density similar to water, whereas source separated organics (SSO), for example, contain less moisture and weigh less. Accordingly, a volume – in gallons – of beverage waste will convert to a greater tonnage than the same volume of SSO.
- Most anaerobic digesters in the U.S. are wet systems, designed to process high moisture feedstocks, such as process water, wash water, and other liquids that contain organic solids.
- Over half of the stand-alone facilities responding to the 2023 survey are co-located at breweries and solely dedicated to processing brewery waste. The use of AD systems at breweries is well-established.
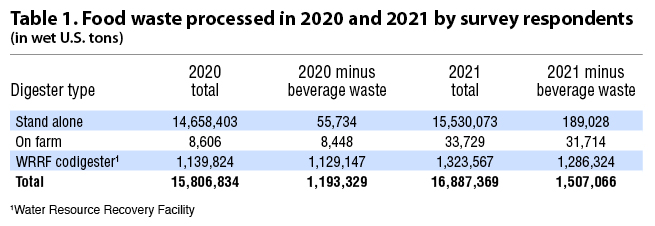
The other top types of food waste processed in 2020 and 2021, from most to least tons, were the following: food processing industry waste; fats, oils and greases; combination of beverage processing and food processing wastes; and source separated residential, commercial and institutional organics (in CY 2020) and retail food wastes (in CY 2021).
Tip Fees, Biogas Production, Digestate
Tipping Fees: Of 38 respondents, 58% reported collecting tipping fees to process food waste and other feedstocks. Nine shared data on tipping fees collected in 2020 and 2021. Based on those responses, in 2020 the median tipping fee was $27.63/ton and the average was $31.82/ton. In 2021, the median tipping fee was $24.26/ton and the average was $30.74/ton. Three facilities reported setting base rates of $0.06, $0.09, and $0.10/gallon of feedstock, respectively. Several charge different rates depending on the quality, type, or source of feedstock. For example, fees might be set higher if food waste needs to be depackaged, grease haulers may be charged but not source separated food waste haulers, or fees are charged to tip food waste but not manure.
Packaged food waste on tip floor at Reinford Farms in Mifflintown, PA. Photos by Nora Goldstein
Biogas Production: Based on the data reported, the combined total amount of biogas produced from food waste and non-food feedstocks by respondents of all digester types was 14,767 standard cubic feet per minute (SCFM) in 2020 and 22,102 SCFM in 2021. (Facility operators reported values in SCFM, SCFD or SCFY, which were converted to SCFM by EPA, and summed to get annual totals.) Thirty-three respondents provided data for 2020 and 34 for 2021. Of 38 responding facilities, 79% reported using a gas cleaning system at the time of survey. The most common constituents removed were hydrogen sulfide, sulfur, and moisture.
Biogas Usage: Only two out of 38 respondents reported selling all the biogas they produced and not using any onsite. The most common use of biogas for WRRFs and farms at the time of the survey was to produce both heat and electricity through combined heat and power systems. The second most common use for WRRFs was as fuel for boilers and furnaces to heat the digesters. For stand-alone facilities, the most common usage was as fuel for boilers and furnaces to heat other spaces (i.e., not the digesters). The second most was to produce electricity for sale to the grid.
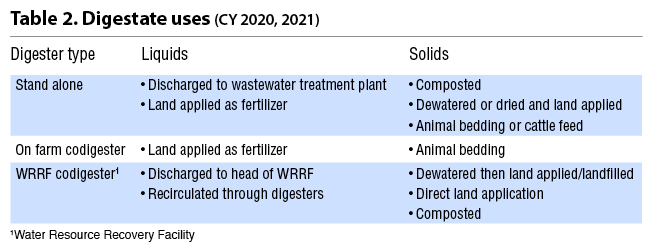
Digestate Management: Table 2 shows reported end uses for liquid and solid digestate streams from the three types of food waste digesters.
AD Of Postconsumer Food Waste
In early July, the American Biogas Council’s (ABC) Data Analysis team released its findings on anaerobic digestion of postconsumer food waste streams in the U.S. “Of the 66 million tons of postconsumer food that goes to waste each year in the U.S., based on our biogas project database we estimate that approximately 5% is recycled by 45 stand-alone AD facilities receiving postconsumer food waste,” says Ian Taylor, ABC’s data and analysis coordinator. “Our data shows that these projects each recycle an average of about 70,000 tons/year of food waste. New facilities in the pipeline, many serving large urban populations and having capacities to recycle 300,000 tons/year or more at each project, will make further inroads into the American food waste mountain. However, the pace we’re on now will not get us to recycling even half of the food waste we produce in most of our lifetimes.”
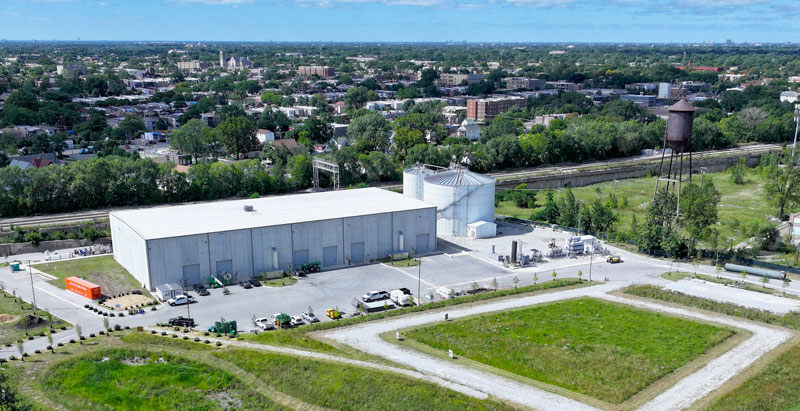
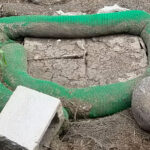
The Green Era stand-alone food waste digester in Chicago accepts pre and postconsumer streams. Photo courtesy of the Green Era Campus
In the interim, he adds, increasing use of built AD infrastructure at farms and WRRFs “is critical.” According to the ABC’s ongoing research, up to 3% of all postconsumer food waste is recycled by 70 farm-based AD codigestion facilities which are supplementing their manure feedstock with a yearly average of 31,200 tons of food waste per facility. The Council also has identified that almost a third of the 1,091 wastewater treatment plants (WTTPs) with operational biogas systems are accepting food waste today. “At these facilities, the food waste is primarily in the form of fats, oil, and grease, which fall outside EPA’s previously quoted figure of 66 million tons of postconsumer waste,” explains Taylor. “While codigestion of food waste at farms and WWTPs is an essential part of the jigsaw, an estimated 87% of currently operational farm-based biogas systems and two-thirds of operational wastewater biogas systems are not known to be currently accepting food waste.”
ABC’s data released on July 2 reports 110 food waste only biogas facilities operating in the U.S., including the 45 plants taking postconsumer food waste. “The remaining 65 facilities are dedicated to preconsumer waste and comprise 29 breweries/distilleries and 36 food manufacturing/food processing facilities,” says Taylor.