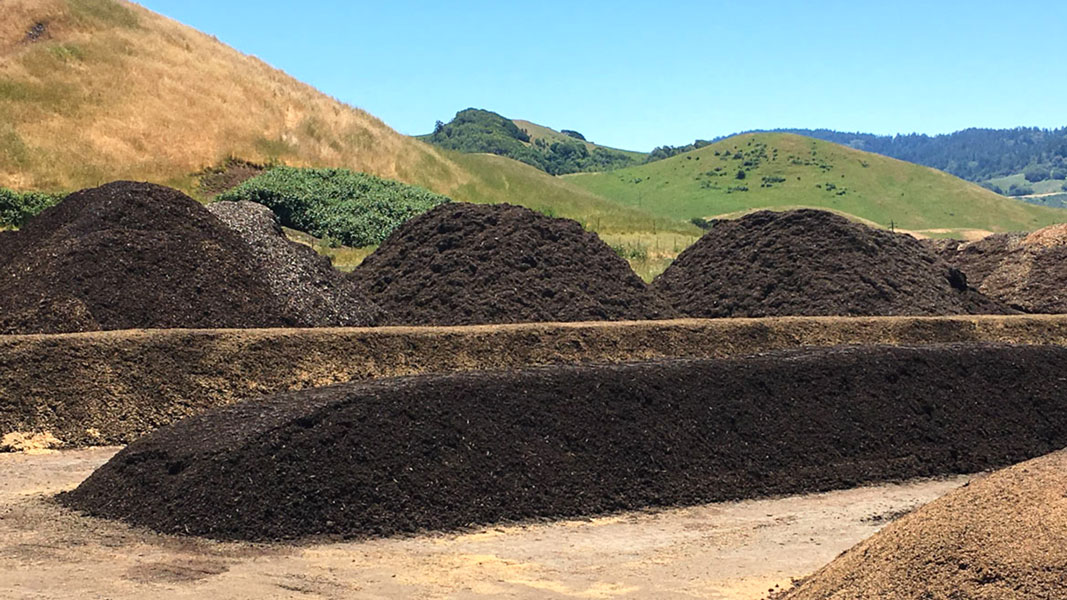
Top: West Marin Compost in Nicasio (CA) uses biochar as a compost amendment. Photo © Pacific Biochar
Liv Johansson and Tim O’Neill
Recent years have witnessed growing interest in biochar’s potential role in organics recycling, partly fueled by claims about its benefits when co-composted with raw feedstocks. Purported advantages include accelerated stabilization, reduced volatile organic compound (VOC) and odor emissions, enhanced nitrogen retention, improved pH regulation, and improved aeration. Most research has been conducted on high nitrogen, low porosity, carbon deficient feedstocks (manures, biosolids, etc.) using passively aerated processes like turned windrows. However, the current growth trend in North American composting is utilization of forced aeration-controlled composting with temperature feedback to process food waste and yard trimmings. These two methods produce measurably different process conditions.
To begin to address this gap, Engineered Compost Systems (ECS) conducted bench-scale trials to evaluate biochar’s potential benefits as an additive in well-aerated, controlled processes using typical curbside collected food waste and yard trimmings.
Biochar Variability
Biochar is a stable, charcoal-like substance produced through pyrolysis of biomass. The chemical and physical characteristics of biochar can vary widely depending on process conditions. Key production conditions, such as pyrolysis temperature, residence time, and feedstock characteristics, create the physical and chemical properties at the surface of the particle. In turn these properties determine how a given biochar functions in a composting process. One simple example is that higher pyrolysis temperatures increase biochar surface area by creating more micropores, enhancing adsorption of gasses and nutrients. Table 1 lists some of the key conditions and the resulting properties and functions (Kamarudin, Nur Salsabila, et al., 2021 discusses mechanisms involved).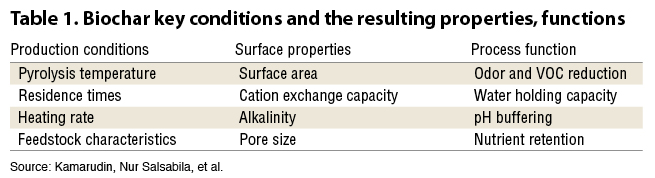
ECS’ research was conducted using three commercially available biochars — Pacific Biochar’s Blacklight Pure, Oregon Biochar’s Rogue, and Qualterra’s Ag Biochar. Table 2 describes their production parameters and the resulting physical and chemical properties.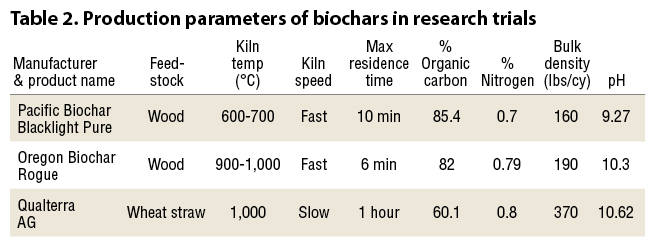
Testing Methodology
Testing was comprised of three sets of trials:
- Trial 1: Assessed biochar’s impact on stabilization rates, moisture retention, and overall product quality in aerated composting.
- Trial 2: Evaluated biochar’s effect on volatile organic compound (VOC) emissions in aerated composting.
- Trial 3: Examined biochar’s influence on initial raw feedstock properties
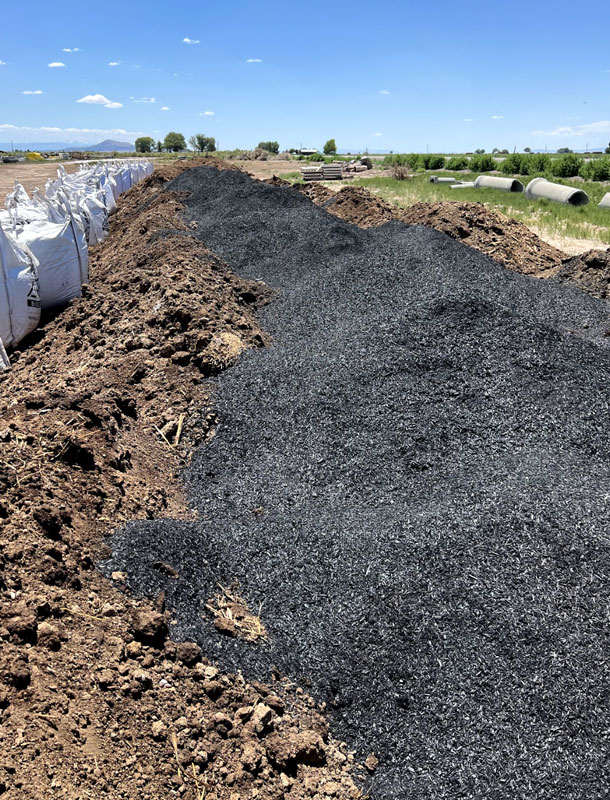
The chemical and physical characteristics of biochars can vary widely depending on production conditions. Photo © Albrecht, Utah Department of Soil Health
In all trials, different types and quantities of biochar were mixed with typical Pacific Northwest green waste and food waste (GW/FW) blends obtained from local commercial facilities. Commonalities among these mixes were bulk densities, good structure, low pH, and high carbon content.
ECS’s Compost Process Lab is equipped with three Aeration Demand Testers (ADTs) that provide precise aeration rates and measure real-time carbon dioxide (CO2), oxygen, and temperatures. Each ADT is a 15-liter sealed stainless steel vessel nested within a temperature-controlled water bath. The temperatures of the headspace, compost sample, and water bath, are logged every ten minutes. This level of control allows for repeatable testing without the variability found in field trials.
For Trials 1 and 2, the laboratory composting reactors replicated conditions found in well-maintained aerated static piles (ASPs). These conditions include maintaining oxygen levels above 15%, uniform and continuous aeration, neutralizing low pH early in the process with a short mesophilic temperature phase, and limiting peak temperatures. All Trial 1 and 2 test mixes followed a consistent preparation procedure, including screening commercial GW/FW mixes to <1 inch, wetting to 58-62% moisture, wetting biochars to 60-70% moisture, and loading vessels with different biochar concentrations (0% control, 5%, and 15% by wet weight) while maintaining equal total initial mass across all ADTs.
pH Considerations
Most GW/FW mixes arrive at composting facilities with pH below 6 — acidic enough to inhibit rates of stabilization (CO2 production) and increase volatile organic compounds ( VOC) and odor emissions. A researcher, Dr. Celia Sundberg, demonstrated how maintaining mesophilic temperatures (ideally <45°C) for the first two days of active composting allows mesophilic microbes to consume organic acids. This neutralizes the pH and facilitates rapid low composting and minimizes odor and VOC emissions.
Biochar tends to be alkaline, thus will raise the pH to some degree by simple chemical addition. To isolate the biochar’s impact on stabilization rates independent of pH neutralization, all Trial 1 and Trial 2 tests were started with a brief (12-36 hours) mesophilic phase so that pH inhibition would not affect the performance of the control batches.
Trial 1 Results: Impact on Stabilization
The metric for stabilizing organic feedstocks is converting biodegradable organic carbon to CO2, which is also the mechanism by which volatile solids (VS) is reduced. Biochar does not provide biodegradable carbon, but it does provide combustible carbon (i.e. VS). The VS of the initial mixes was measured on day 1 and at the end of the trials on day 13 (Figure 1).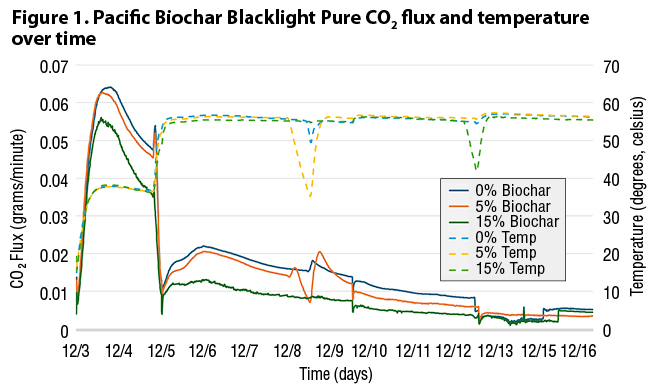
Table 3 provides the VS destruction in the biochar amended mixes as a percentage of the VS destruction in the baseline mix. These results suggest that different biochars provide very different effects on stabilization rates. The Oregon biochar appears to have a negative effect on VS destruction. The Qualterra biochar test results, although the data is inconsistent, significantly enhanced VS destruction. The Pacific biochar, unlike the others, appears to have increased the initial VS slightly over the baseline, and to have moderately increased the VS destruction during composting.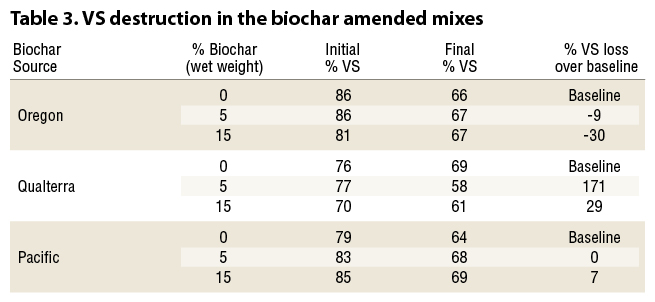
Oven-drying analyses indicate minimal impact of biochar on moisture retention during active composting. In all Trial 1 tests, vessels containing 15% biochar failed to outperform the controls over the 14-day period. The 5% biochar treatments slightly outperformed both control and 15% treatments, but by negligible margins (1-2% over 14 days).
Regarding nitrogen conservation, our findings did not agree with biochar’s purported benefits. Previous supportive studies typically evaluated biochar combined with nitrogen-rich feedstocks in poorly aerated systems. In such conditions, biochar’s lightweight properties might improve bulk density, enhancing process conditions. However, our trials demonstrated that the biochar we tested did not increase nitrogen retention at any of our mix ratios. In fact, the addition of biochar actually appears to have decreased nitrogen concentrations while showing minimal to moderate effects on organic carbon compared to controls.
Trial 2: VOC Emissions
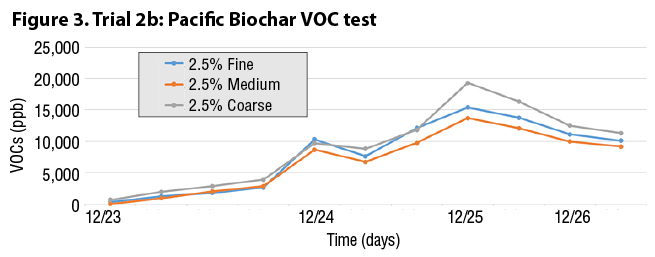
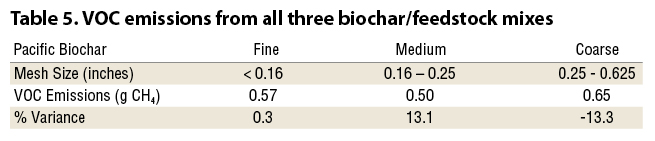
Composting facilities in regions with stringent air regulations can benefit from methods that reduce the emissions of volatile organic compounds. In Trial 2 the goal was to measure the VOC-reducing effects gained by adding biochar to the test mix. Trial 2a measured VOC emissions from the ADT while composting the GW/FW mix with the addition of 0% (baseline), 5%, and 15% biochar on a wet-weight basis. Temperatures and aeration rates were identical in all three ADTS. Trial 2b attempted to measure the impact of biochar particle size on VOC absorption/emissions. We had noted the significant difference in particle sizes between different biochars, and wanted to test if smaller particles would provide more VOC absorbing surface area. The Pacific Biochar was crushed and sieved into three sizes: Fine (<0.16″), Medium (0.16-0.25″), and Coarse (0.25-0.625″), and mixed with the GW/FW blend at 2.5% wet-weight basis. Aeration rates and ADT temperatures were identical in these tests as well.
In Trial 2a and 2b, a mini photoionization flame detector (PID) was used to measure total VOC flux, expressed as methane equivalents in the results. Figure 2 shows the test results with Trial 2a and Figure 3 shows results for Trial 2b.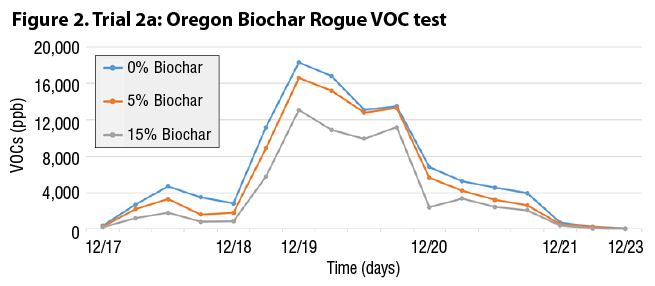
A standard pattern of CO2 flux was observed, with emissions peaking after temperatures from 45°C to 60°C. VOC emissions remained relatively low during the early mesophilic phase but increased to peak roughly simultaneously with CO2 concentrations. The relationship between temperature and VOCs is well established — VOCs are low vapor-pressure gases, and temperature increases can liberate them into gaseous form. We also observed that VOC emissions fell to zero ppb within five days in all ADTs. This aligns with other studies demonstrating that VOC emissions quickly taper to very low in well-controlled composting operations (Jobson, 2021).
From these tests, the Oregon Biochar appears to have a meaningful impact on total VOC emissions. Adjusted for dry weight, adding 5% biochar to the GW/FW mix reduced emissions by 15.9%, while 15% biochar reduced emissions by 35.6% (Table 4).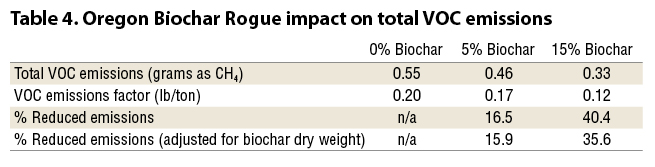
VOC emissions from all three biochar/feedstock mixes were similar (Table 5), but with medium biochar performing best at minimizing VOCs, contradicting our hypothesis that fine biochar would have the most significant effect. It appears likely that the manufacturing conditions, namely pyrolysis temperature and residence time that determine the formation of micropores, have a much more significant effect on gas absorption than gross particle size.
Trial 3 Results: Raw Feedstock Properties
Water Holding Capacity (WHC)
Results from the oven-drying tests showed that none of the biochar samples significantly outperformed the natural water holding capacity of raw GW/FW feedstocks. When compared to the control, Qualterra AG biochar showed similar performance, while Oregon Rogue Biochar retained about 5% more water. The results for Qualterra AG were somewhat unexpected given its finer particle size, but research indicates biochar hydrophobicity increases as particle size decreases, reducing water retention capacity (Edeh et. Al., 2021).
Squeeze Test
At 60% moisture, both the control sample and the Qualterra AG sample with 5% biochar exhibited typical behavior in hand-squeeze tests: material held together well, left an even sheen on the glove, and released 1-to-3 drops of free water. However, the Qualterra sample with 15% biochar, and both Oregon Biochar Rogue samples appeared much drier than 60%, with the Oregon 15% sample not clumping at all and leaving no liquid sheen, feeling like material closer to 40% moisture. The addition of significant amounts of biochar therefore might confuse operators who are accustomed to using the squeeze test to assess moisture content.
pH Changes
To test biochar’s purported liming effect, we took a gallon of GW/FW mix, “spiked” it with lemon juice to achieve a pH 4.75, and gradually added biochar until it reached a neutral pH. Achieving pH 7 required 13% Qualterra biochar compared to 67% Oregon biochar on a dry-weight basis (Figure 4).
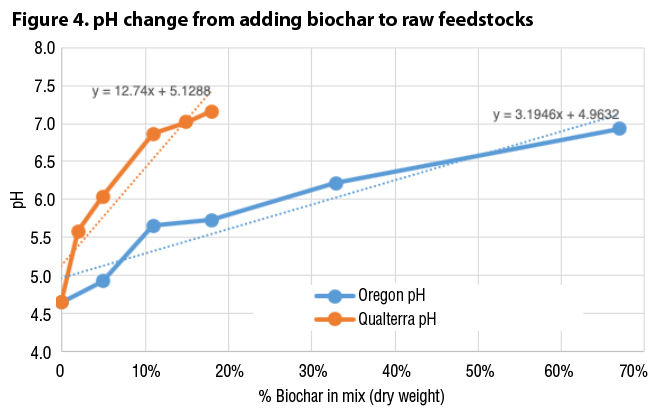
This performance difference likely stems from several factors: Qualterra AG biochar was more alkaline (pH 10.62 vs. 9.27), had finer texture providing greater surface area for ion exchange, and contained 30.8% ash — over three times Oregon biochar’s 9.3% ash content. Since biochar’s alkalizing effect is generally attributed to ash content, this difference is predictable, and important to note for composters who desire to increase pH through amending with biochar (Singh et. Al., 2017).
Conclusions: Is Biochar Cost Effective?
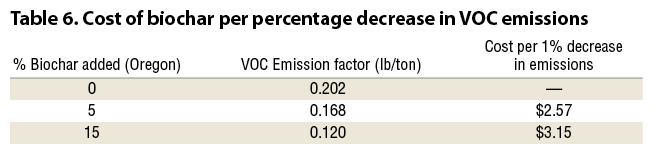
For a high-level economic analysis, the various process improvements tested were ratioed with a generic cost of adding biochar (purchase, delivery and material handling) of $850/ton. This cost was roughly the average in the range of quotations we received. Table 6 calculates the cost for the VOC test results, as an example.
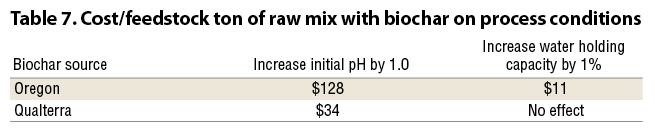 Under our test conditions, we found that biochars manufactured under different conditions provided different composting process benefits. For example, the Qualterra AG product, a finer more ash-heavy biochar, appeared better at increasing the feedstock mix’s pH but not its water holding capacity. The Oregon biochar, on the other hand, did improve the feedstock mix’s water holding capacity but also appeared to dilute total nitrogen in the finished compost sample (Table 7).
Our results indicate that co-composting carbon-rich feedstocks with biochar in a well-aerated process does not provide the impressive level of benefits reported in the literature for high nitrogen residuals composted with passive aeration. When considering co-composting with biochar, facility operators should assess the characteristics of their starting mix and the properties of the biochars available to them. We then recommend running trials to measure the process effects at various dosing levels. With this data, each facility can weigh the costs of procuring and incorporating biochar against their specific operational goals and regulatory requirements to determine if using biochar makes economic sense for their composting process.
A more detailed report of ECS’ research and findings is available at this link.
Tim O’Neill, president and founder of ECS, has worked in the compost industry since 1993 and has been responsible for the development and manufacture of compost process control systems. His expertise includes compost aeration and control, regulatory compliance, and process and monitoring technology. He serves as a Trustee for the Compost Research and Education Foundation. Liv Johansson supports science, operations, and permitting work at ECS, and formerly served as a compost facility operator for the Woodland Park Zoo’s manure composting operation. She is treasurer of the Washington Organic Recycling Council and leads the Council’s annual Compost Facility Operator Training course.