BioCycle May 2018
NYC Releases Waste Characterization Results
The New York City Department of Sanitation (DSNY), in partnership with Sims Municipal Recycling, released its fourth waste characterization study titled “2017 NYC Residential, School, and NYCHA Waste Characterization Study,” which provides an overview of what New Yorkers put in their trash, recycling and organics bins. NYCHA is the NYC Housing Authority. Highlights include:
• In 2017, residential collections were down to less than 3.1 million tons/year, with 2.5 million tons disposed as refuse. These totals dropped from 2005, when residential curbside collections totaled nearly 3.5 million tons/year, with 2.8 million tons disposed as refuse.
• On a per household basis, the average NYC household in 2017 discarded less than 1,990 lbs/year of aggregate discards, down from 2,000 lbs in 2013 and about 2,280 lbs/year in 2005.
• Households generated more non-bottle rigid plastic waste, and food scraps and food-soiled paper suitable for composting, than in years prior and the quantity of harmful household products and textiles increased.
• In 2017, 34 percent of curbside residential waste was recyclable, 34 percent was organics suitable for composting, 23 percent was other, and 9 percent was other divertable materials.
• 59.9 percent (by weight) of organic waste was yard trimmings, 31.0 percent was food scraps, 7.1 percent was other, and 2.0 percent was compostable paper. It also showed that contamination rates in organics collection were low, averaging about 7 percent.
• 51 percent of the waste collected from schools was organics suitable for composting, 35 percent was recyclable, 12 percent was other, and 2 percent was other divertable materials.
Meal Kit Company Tracks, Donates Excess Food
The meal kit company, HelloFresh, has expanded rapidly in the U.S., delivering more than a million meals a week. Accommodating rapid growth means increasing food purchases. While its subscription model helps predict demand, some surplus is inevitable. This reality led HelloFresh to work with Spoiler Alert, a technology company helping food businesses manage unsold inventory. The net result? A decrease in landfill-bound organic waste by 65 percent, reduction in waste hauling pickups by 44 percent, and nearly double the percentage of unsold inventory donated to charities, from 33 to 61 percent of total volume — equivalent to more than one million meals comprised of fresh ingredients, based on USDA’s calculation of 1.2 pounds per meal.
Adding Urban Forests As Cities Grow
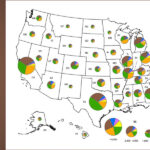
A study by the U.S. Department of Agriculture (USDA) Forest Service found the need for urban forests will continue to grow as cities use more land. U.S. urban land increased from 57.9 million acres (2.6%) in 2000 to 68.0 million acres (3.0%) in 2010. Between 2010 and 2060, the study projects urban land to increase another 95.5 million acres to 163.1 million acres (8.6%) with 18 states projected to have an increase of over 2 million acres.
Overall, there are an estimated 5.5 billion trees (39.4% tree cover) in urban areas nationally that contain 127 million acres of leaf area and 44 million tons of dry-weight leaf biomass. Annually, these trees produce a total of $18.3 billion in value related to air pollution removal ($5.4 billion), reduced building energy use ($5.4 billion), carbon sequestration ($4.8 billion) and avoided pollutant emissions ($2.7 billion) — plus feedstocks to make compost! States with greatest annual urban forest values were: Florida ($1.9 billion), California ($1.4 billion), Pennsylvania ($1.1 billion), New York ($1.0 billion) and Ohio ($971 million).
Assessing Public Agency Food Waste Activities
“A qualitative study of United States food waste programs and activities at the state and local level,” published in the Journal of Hunger and Environmental Nutrition (December 2017), reports findings of an assessment of how public agencies are addressing food waste prevention and food recovery. The authors, Christine Benson, William Daniell, and Jennifer Otten of the University of Washington, conducted interviews with 10 public agencies heavily involved in food waste prevention and recovery. They explored their capacity to addressing wasted food, challenges encountered and how these were overcome, and recommendations for addressing the problem at a broader systems level.
The 10 agencies were geographically diverse (2 South, 1 Midwest, 1 Northeast, 6 West) and varied in scale of jurisdiction (5 county, 4 state, 1 national). The departments in which food waste reduction and prevention initiatives were housed differed, but were most often under waste management or environmental protection. Initiatives ranged from overseeing one local food waste prevention or recovery program to multilevel programs, some with a national focus. Key findings — excerpted from the Journal article, include:
• Interviewees often described their food recovery programs and activities “as more comprehensive than prevention programs because they were related to the long-standing existing emergency food system and also because food recovery programs were characterized as easier to understand and implement. In contrast, prevention programs and activities were often described as harder to implement due in part to a lack of the existing programs or strategies on which to learn from or model.”
• Main challenges “included the disorganized nature of the current efforts that occurred throughout the agency or across agencies or even within the larger municipality or state; difficulties in effectively engaging key players throughout the system, often due to competing priorities, general misperceptions, or a lack of education; and a lack of common metrics or measurements to describe the problem and garner support for it.” Another challenge was perceived conflict between different levels of the EPA food recovery hierarchy, e.g., “making improvements at a prevention and donation level often interfered with how compost and recycling success was viewed.”
Strategies that helped interviewees overcome the challenges include: 1) Use what metrics existed or could easily be collected to build support for programs; 2) Identify what activities are in place and build on them; 3) Combine resources from different sectors to bolster support; and 4) Employ a slow and phased-in approach to implementation.


