How compost earned its #60 ranking in Drawdown. Part II
Sally Brown
Our California road trip, launched last week with a discussion of climate change fundamentals, continues this week with a conversation about methane. Let’s start with Drawdown’s cited benefit of compost — methane avoidance — and why that earned compost its #60 ranking on the list of solutions.
Why the fuss over methane (CH4)? Each molecule of CO2 has an approximate life span. Carbon accounting is typically done on a 100-year time frame. While CO2 is the main culprit for holding onto heat, other gases also do this, many of which are much better at it than CO2. (If you go back to Drawdown, the #1 solution has to do with refrigerant gases.) Methane excels at holding onto heat. It is typically ranked at about 23 times more effective than CO2 over that 100-year time frame. The catch is that a molecule of methane only lasts about 12 years in the atmosphere. Over a shorter time frame it really packs a punch. You can think of methane as taking over that #1 spot and pushing CO2 down to where Compost currently is on the Drawdown list.
Just like CO2, methane comes from eating. The difference is that it is produced when you eat without any oxygen around to absorb the released carbon. We can’t eat without oxygen. People without oxygen = suffocation. However, a wide range of microbes can. These microbes exist in our intestines and they exist in landfills.
True fact — a major source of greenhouse gases (GHGs) from agriculture is cow farts. Microbes in the cow’s rumens generate methane. Antacids for cows could have a very big impact. There is research on using biochar as a way to absorb CH4 in cow intestines (Hansen, et al, 2013).
If properly contained and controlled, we can get microbes to eat and produce natural gas, aka biogas. If not properly contained, methane release is a real problem. The good news is we can control methane release relatively easily, at least from anthropogenic sources. Landfills happen to be one of the primary anthropogenic sources.
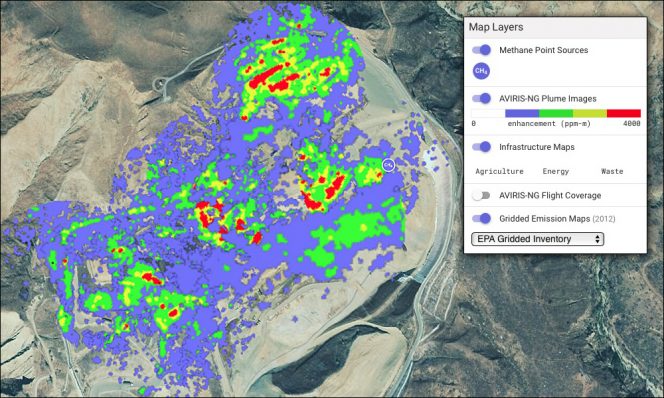
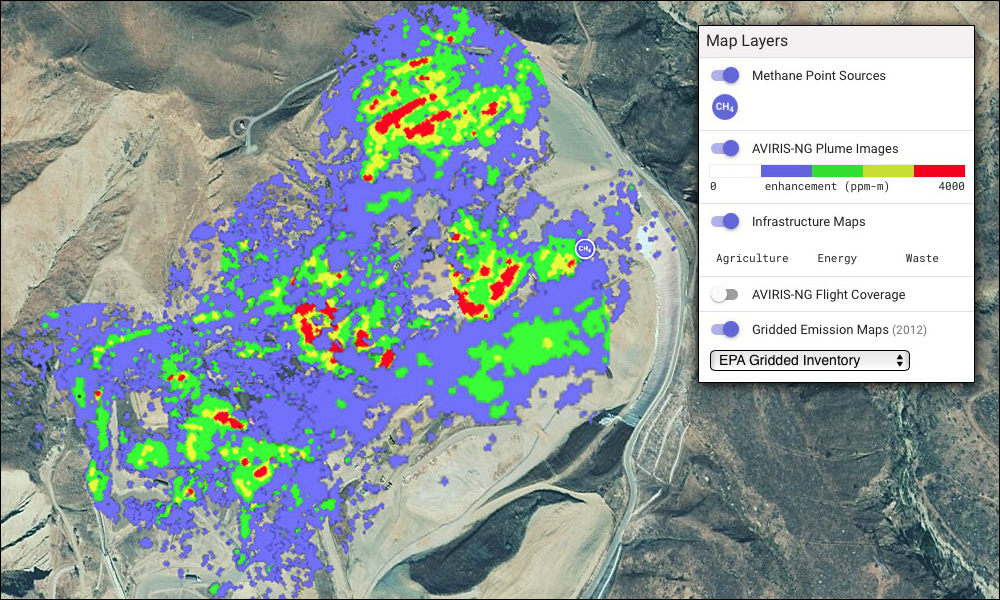
Example of a methane (CH4) plume emanating from a (random) California landfill. Source: NASA Methane Source Finder (https://methane.jpl.nasa.gov)
Landfill Methane Emissions
There has been and continues to be a big debate on just how bad landfills are as a source of methane — 10 years after my white paper, “Putting The Landfill Energy Myth To Rest”, ran in BioCycle.
Sanitary landfills take our garbage, squash it and build clay cells around it. When the cell is full it is closed up and gas collection systems go into place. The methane produced after closure is typically collected and used. The methane produced before closure is typically released. The surface of a landfill, in particular the active surface, is not uniform and neither is gas release. To understand, I refer you to two columns I wrote in BioCycle, “Landfill Gas Math” and “Landfill Gas Math, Take 2”. If you look in the scientific literature, you can find papers estimating how much methane different materials produce, how soon after landfilling that methane production starts, and how effective landfills are at capturing that methane.
In an early version of the US EPA WARM (Waste reduction model), landfills were considered to have high efficiency at methane collection for the life of the landfill. More recently, WARM was revised to reflect the fact that performance varies by time and location. This more recent WARM recognized that food scraps in particular produce significant quantities of methane long before landfill caps go on. The model gave the equivalent credit of about 1 ton of CO2 for each wet ton of food scraps taken out of the landfill.
EPA isn’t the only one to recognize this. The Climate Action Reserve (CAR), the only carbon crediting agency in the U.S. that pays for carbon credits (at least that I’m aware of), gives you credit for landfill diversion of food scraps. What is critical here is that the protocol and the model were based on models — not a robust data set of measured emissions from landfills. That just changed.
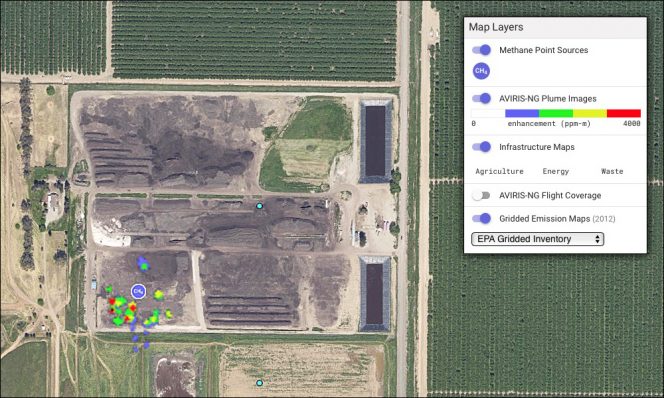
Example of a methane (CH4) plume emanating from a (random) California composting site. (Note: BioCycle had to examine many composting site fly-over images in order to find one featuring a methane plume). Source: NASA Methane Source Finder (https://methane.jpl.nasa.gov)
Real Time Methane Emissions
A recent study out of California did fly-by measures of methane from over 270,000 potential sources over three years (Duren, et al, 2019). Researchers connected a remote sensing spectrometer to aircraft and were able to capture plumes in real time. They looked for methane over oil and gas facilities, manure feedlots and lagoons, composting facilities and landfills. They identified 574 strong point sources that accounted for 34% to 46% of the total CH4 produced in the state (see image). Landfills take the top spot, accounting for 41% of the observed emissions. Dairies and oil and gas facilities are tied for second, each accounting for 26%. Only a small fraction of the landfills showed persistent plumes meaning that this is really something that can be fixed.
These super emitting landfills were found in a state that is aggressively trying to get food scraps out of the landfill. California is far from reaching that goal but is a whole lot closer than states that aren’t even making the effort. For argument’s sake, let’s say that they are at 30% diversion. If all of those moldy leftovers had gone to composting, it is highly likely the plumes that were found would have been smaller and less of a concern. So I am fine about Drawdown ranking Compost as #60, just for composting’s role in reducing methane emissions. What is really critical is the part that merited a sentence in their write up: That total (amount of potential CO2 drawn down) excludes any additional gains from applying compost to soils. That is where we go next.
Sally Brown, BioCycle’s Senior Adviser and long-time Connections columnist, is a Research Professor in the College of the Environment at the University of Washington. She can be reached at slb@uw.edu.


