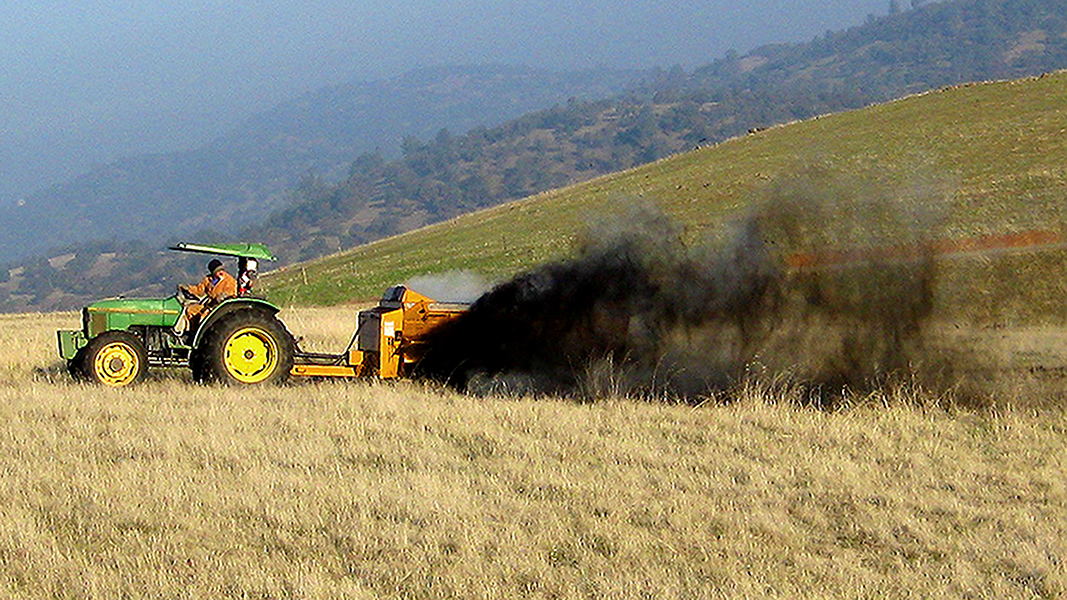
Top: Photo of compost application by Rebecca Ryals, University of California, Merced
 Sally Brown
It almost rhymes. Figure everybody reading this knows that SOM stands for Soil Organic Matter. Figure that few of you know that EOM stands for Exogenous Organic Matter. I myself am a new convert to the term, but now I’m all in. Exogenous means “relating to or developing from external factors.” In the case of soil organic matter, it means putting stuff on the soil that you got from somewhere else. Think of it as the opposite of cover crops and stubble.
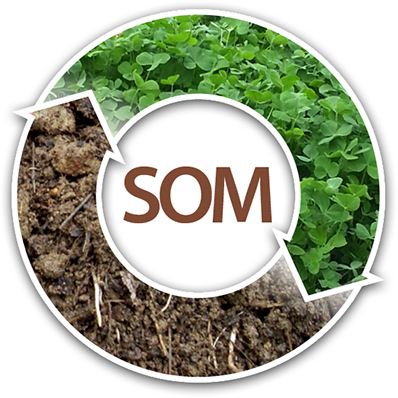
Most tools to increase SOM on a global scale focus on management options in place like use of cover crops.
Included in the broad category of EOM are materials that are very familiar: composts, digestates, biosolids, and manures. They all represent types of organic matter that are brought to the soil and used as amendments instead of grown in place, like cover crops. The term is used in the context of discussions of soil as a partial solution to climate change. More and more in the scientific literature you see recognition of soil carbon storage as a viable means to reduce atmospheric carbon and also enhance soil health. Healthy soils are also climate resilient soils.
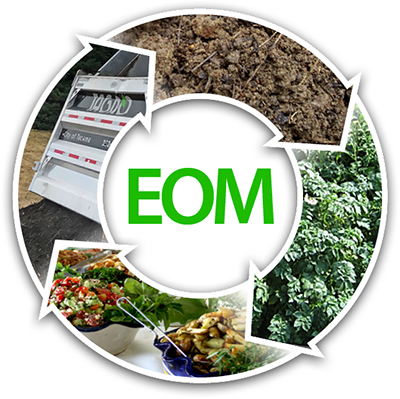
EOM is based on bringing organic matter to the soil from outside sources — materials that originated in soil but were moved off site and the residuals are brought back.
The papers that I’ve read talk about this potential solution on a global scale. Global scale means big picture. Things that are included in these papers are planting more trees and cutting down fewer trees. Also mentioned are keeping grasslands in grass and managing the grazing on those lands to limit degradation. While many of the papers talk about biochar, it is most often mentioned as a way to restore old and tired tropical soils, not as a means to save humanity as a whole.
With these solutions, implemented across oceans and continents, there is a potential to store 23.9 gigatons (Gt) of carbon dioxide (CO2) annually. To quote Bossio et al. (2020), “Soil carbon is important to land-based efforts to prevent carbon emissions, remove atmospheric carbon dioxide and deliver ecosystem services in addition to climate mitigation.” The papers I reviewed reference a number of initiatives where the goal is to make this a reality. One of them is the 4p1000. The name of that initiative comes from its goal to increase soil carbon (soil C) by 4% annually across the globe.
EOM Is Buried Deep
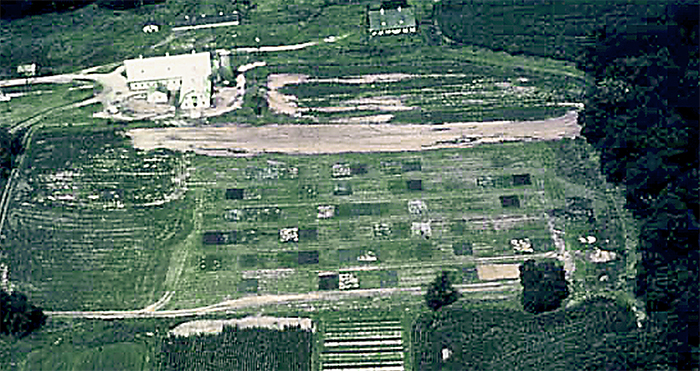
Long-term research plots at Hayden Farm in Maryland used for EOM studies conducted by the USDA Beltsville Agricultural Research Center. Photo courtesy of Dr. Rufus Chaney
EOM is mentioned in these papers but it is buried deep (pun intended). EOM is not the first action item on the list. That is because if you go to fields in most of the world, they don’t have access to much of the EOM that many of us still consider waste. There are no digestates, composts or biosolids in areas of the world without sanitation or centralized waste collection. However, in areas where EOM is an option, very often there are mountains of it that no one has spoken for. I looked for more papers that focused on EOM and found a few. Here the emphasis was on how to model carbon storage in soils where managers/ farmers do have access to the range of EOM. By using models, we can understand the larger scale implications of EOM without the need to set up a new replicated field trial at each site (versus using only replicated field trials). Models take data from all available replicated field trials and synthesize them to come up with values that are robust and applicable to multiple fields and multiple types of EOM. This is the much preferred alternative to making stuff up. Let me tell you about two of these models.
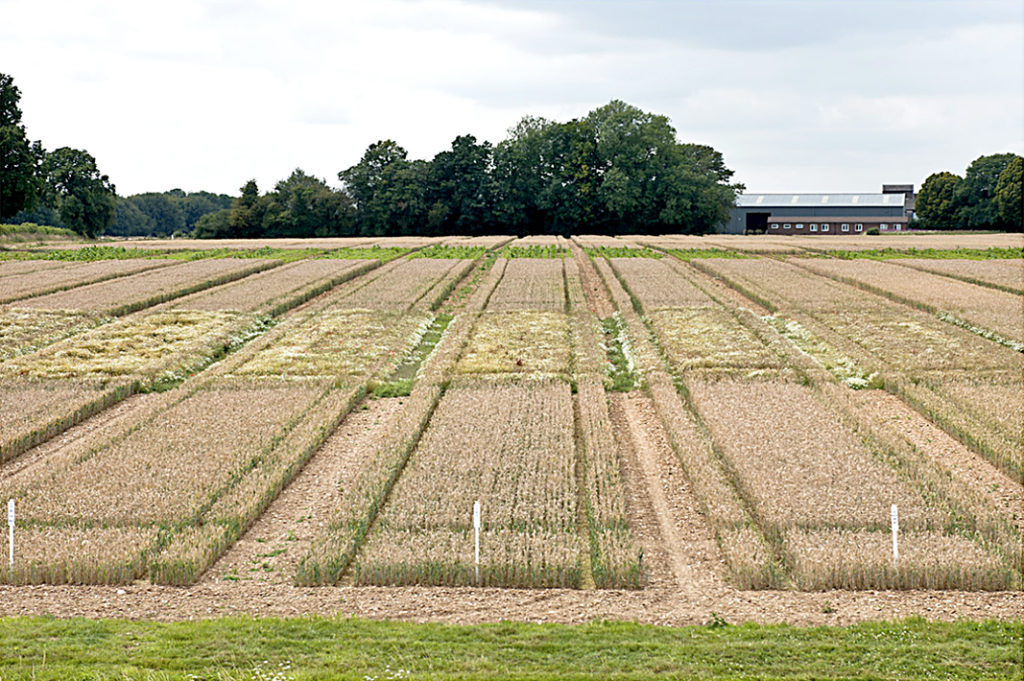
Broadbalk field at the Rothamsted Experiment Station in the United Kingdom, where long-term experiments began in 1843, and continue today. Photo source: Rothamsted Experiment Station
RothC: The RothC model is named after the long-term field trial in Rothamsted in the United Kingdom. While the model is able to predict changes in soil C based on practices like fertilizer addition and tillage, recent work has added in the ability to predict changes based on EOM amendments. To do this, the researchers (Peltre et al, 2012) split each EOM type into fractions of labile (DPM), resistant (RPM) and humified (HUM). Labile materials will break down relatively quickly, resistant will put up more of a fight against decomposition, and humified are quite content to stay put as is.
There is a built in transfer of C from the resistant to the labile and humified pools. The speed of this transfer is determined in part by the clay content of the soil. The EOMs that are typical in our world have relatively high resistant organic matter, ranging from 38% of total C for a MSW compost to 85% for the biosolids. Then the model turns this into a rate of carbon accumulation in soils. The rate of C accumulation (tons of C ha-1 yr-1) for the EOM modeled based on an application of 2 tons ha-1 for 20 years (20 tons ha-1 cumulative loading) is:
- Biosolids: 0.38
- MSW: 0.18
- Green waste + biosolids compost: 0.39
- Biowaste compost: 0.42
Or pretty damn high.
AMG Model: The AMG is the next model to embrace EOMs. Here again, the authors (Levavasseur et al, 2020) look at a range of different types of EOM from as many long-term field trials that they could find. AMG puts soil carbon into different pools — stable and active. Here the h value represents the fraction of the added carbon that stays in the soil, at least for a while. The part that goes right to CO2 (i.e., emitted before it can get stored) is the 1-h fraction. That means that the higher the h the more likely the amendment increases soil carbon. Here are some of the h values (% of C remaining in soil) from the model:
- Peat: 86
- Green waste and biosolids compost: 43
- Poultry manure: 8
- Green waste and biowaste compost: 100
- MSW compost: 82
- Green waste compost: 100
- Biosolids: 66
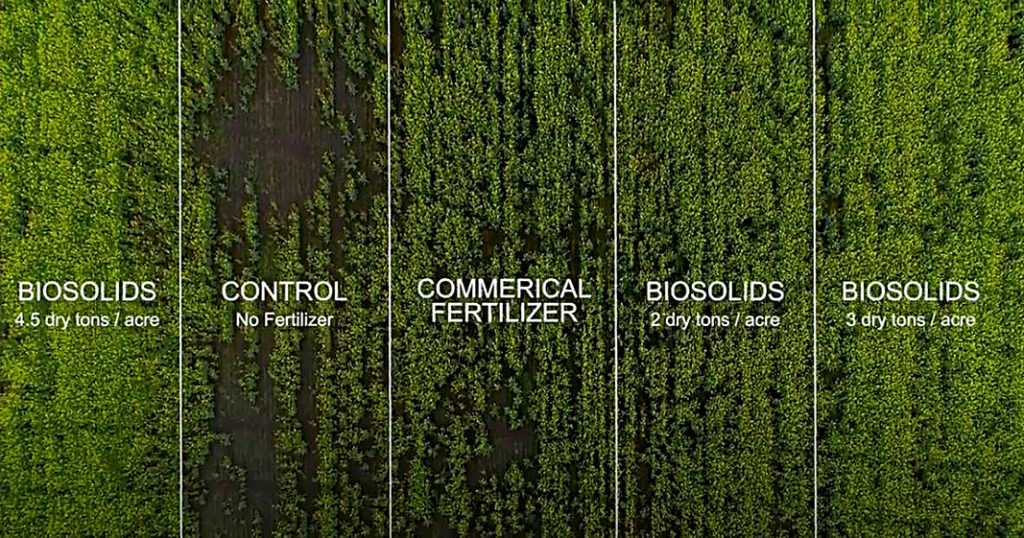
Aerial photo of long-term research plots that receive King County (WA) biosolids to grow dryland wheat. Photo courtesy of King County
Pie In The Sky Or Real In The Dirt?
The last paper I read on this topic (Poulton, et. al, 2017) was focused on whether the tools that we have to heal soils are realistic. Is the 4p1000 initiative pie in the sky or real in the dirt? The authors looked at increases in SOM from use of EOM (has a nice ring to it, I have to repeat that) from long-term field trials. Remember here that soils that are degraded will show increased organic matter with proper care that will eventually come into equilibrium. Average application rates for each 10-year time period were high — a total of 311, 402, and 176 tons/hectare. Biosolids and the biosolids compost were not applied or data wasn’t reported for the last time period. Table 1 shows the percent increases for regular application rates of the different amendments. Each percent is for a 10- year period. Trends were consistent — big percent increases at first that level off.
You double the application rate (many of the sites included in the model had normal and 2x application rates) and the percent goes even more dramatically through the roof. Rather than broadcasting these results with a bullhorn, the authors conclude that there isn’t enough EOM to go around so we better come up with a Plan B. Early on in this column, I talked about how EOM is mentioned but buried deep in the big picture papers. That is because most of the world doesn’t have either MSW-based materials or municipal biosolids. That tells me two things.
- Does that mean that the places that do should discard them? Hell no! We have access to the best tools around. Forget 4p1000 — we can do 50p1000. Let’s be sure to spread the gold that we have.
- Not only does everybody poop, food waste is not only a first world problem. While most of the world is lacking centralized wastewater collection and treatment, the importance of sanitation is a key development goal. Reducing food waste and appropriate treatment of the material that does spoil is another goal. Integrating the value of these EOMS for use on degraded soils needs to be part of the development paradigm.
Take heart that use of EOMs are the best tools around for making soil an effective repository for carbon. Use this information to provide quantitative values for the benefits of what you do. Also use it to turn the discussion around from landfill diversion to soil regeneration.
Sally Brown, BioCycle’s Senior Advisor, is a Research Professor at the University of Washington in the College of the Environment.


