 Sally Brown
We’ve gone from famine to feast in terms of providing nutrients to help plants grow. Back in the day we had to stoop to raiding caves for bird poop (guano), or collecting our own poop (night soil) to make sure our plants didn’t go hungry. Now, too often we rely on the equivalent of a fast food menu. You have your choice of MAP or DAP (mono or di-ammonium phosphate). Both are nice looking crystals and it is very easy to supersize. Farmers applying excess quantities of MAP and DAP are now a big problem.
Drawdown has included nutrients, specifically nitrogen management, on the list of tools to reduce carbon dioxide (CO2) concentrations in the atmosphere. It points out that overuse of nitrogen fertilizers has resulted in high emissions of nitrous oxide (N2O), a really potent greenhouse gas with 296 times the warming potential of CO2. By reducing use of excess fertilizer, these emissions could be reduced by 2.3 to 12.1 gigatons of CO2. Plus, farmers could save money because buying MAP or DAP isn’t cheap. Instead of over applying fertilizer they recommend that you stick to the 4Rs principle:
- Right source — Use the right kind of fertilizer for your plants
- Right time — Feed those plants when they’re hungry
- Right place — Put that food where their roots can reach
- Right rate — Choose the appropriate portion size
The picture on Drawdown‘s nutrient page shows a lime green slime of algae sitting on top of an otherwise lovely blue body of water. In addition to N2O, using nitrogen causes a world of other problems, eutrophication of water being among the big ones. Nitrogen is a scientists’ dream. It is messy, leaky and unpredictable. You finish one study on nitrogen fertilizer and you start another four.
Nitrogen Basics
- Nitrogen gas makes up most of our atmosphere (77%). It doesn’t hurt or help much of anything in that form.
- It takes a lot of energy to convert N from a gas to a solid form that plants and animals can eat (use).
- We figured out how to do this in the early 1900s. It is an energy intensive process — using the equivalent of 4 kgs of CO2 to ‘fix’ 1 kg of N as ammonia.
- Certain microbes know how to do this — convert the gas to a usable or mineral form. These include rhizobia and Frankia. These microbes latch on to plant roots and trade sugar from the plant for the nitrogen. Legumes are the most familiar category of plants that make friends with these microbes. Legumes include clover, beans, lupin, and alfalfa, to name a few.
- There are three solid forms of nitrogen: ammonia (NH3+), nitrate (NO3-) and organic nitrogen (nitrogen in plant or animal matter). The nitrogen cycle describes how nitrogen moves up down, around and sideways.
Nitrogen In Soils
Nitrogen in soils (except for organic N) is ready to travel. It can go back to the atmosphere as ammonia gas, NOx compounds, N2O or N2 (nitrogen gas). It can move to water as nitrate.
Trying to account for all of the nitrogen in a system is like trying to match up all of your socks when you do the wash. The soil, air, and water system is very leaky when it comes to nitrogen. That is why using synthetic N fertilizer is a problem. It is typically applied once or twice during a growing season and it is always applied in a form that is ready for travel.
The good news is that we are also very leaky when it comes to nitrogen. All manures contain significant amounts of nitrogen because no animal uses all of the nitrogen it eats. Urine is even better than the solid stuff; it’s very rich in nitrogen in the form of urea. Food scraps contain not only nitrogen but all of the other nutrients that the plants need to grow in the first place. Unlike the synthetic forms of N, the stuff that we excrete or waste contains the nitrogen primarily in an organic form. The same applies to animal waste. Protein is one example. In order for this N to be used by plants, it has to first be converted into a mineral form. This is done by soil microbes over time, making N in residuals a slow release form of the nutrient. As a slow release, it is much less likely to pick up and go.
Drawdown is absolutely on the money that we use too much synthetic N fertilizer. One fact that they don’t mention about N fertilizers is how much energy they take to make. Synthesizing 1 kg of N from the atmosphere using industrial processes takes about 4 kg of CO2. In the write up, the authors point out that you can go one step better than the 4Rs. Real nutrient management, they say, only happens when you use rotational, regenerative land practices. I would argue that real nutrient management only happens if you use the nitrogen we already have in hand instead of making new stuff. Here I mean the nitrogen in organics. It is not clear if using residual-based N means less N2O emissions than fertilizer N — though signs point to “yes.” It is clear that if you use what you have you save the 4 kgs of CO2 that it costs to make each kg of the new stuff.
As with the other topics in this series, let’s take the nitrogen on a road trip to California to see how this would play out. In addition to producing movie stars and tech start-ups, California grows a lot of food.
Nitrous Oxide Basics
Nitrous oxide (N2O) is never made on purpose. It is a gas that is typically formed when microbes want someplace to put electrons when there isn’t enough oxygen to go around. When you eat, you get energy from breaking carbon bonds. The energy in the food we eat is expressed as calories. We are all familiar with those. Releasing energy means releasing the electrons that have been shoved onto the carbon atom to make it transform from CO2 to fixed carbon. Potato chips are a delicious example of fixed carbon. As we eat those potato chips the carbon in the chips turns back into CO2 and the electrons reduce oxygen gas and turn it into water. Microbes eat too, though not necessarily potato chips. Many microbes have the ability to shove electrons onto nitrogen (nitrate nitrogen). The ultimate goal here is to return N to N2 gas. Sometimes though, that reaction doesn’t go to completion and N2O is released.
The International Panel on Climate Change uses a default factor of 1% of total N applied to estimate how much N2O is released when you add fertilizers to soil. Remember that N2O isn’t made on purpose and so emissions can vary greatly and be hard to predict. Recent studies have looked at N2O emissions from fertilizers in comparison to organic sources of nitrogen including composts and manures. They’ve also looked at emissions from fine (clayey) versus coarse (sandy) textured soils and for annual versus perennial crops.
In general, emissions from organic sources are lower than from fertilizers. The drier and more stable the source, the lower the emissions factor. For example, average emissions from compost were 0.02% of total N. Emissions from solid manure were 0.35% of total N. Wetter materials, like pig slurry had higher emissions (1.21% of total N). However, soil texture may be more important than the source of N with emissions — 2.8 times higher on fine textured soils in comparison to coarse textured soils. If you use compost on a sandy soil you are likely to have minimal to no N2O emissions. If you apply pig slurry on a clay soil you will likely have high N2O emissions.
Nitrogen Math Class
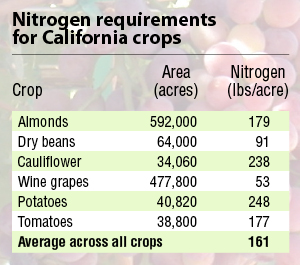 For this Connections Column, we can focus on California’s agriculture. There are 27.6 million acres of agricultural land in the state. About 40% is used to grow crops; the remainder is used for pasture and rangeland. Orchards and vineyards took up close to 3 million acres in 2002. Vegetables and melons took up another 1.2 million with hay grown on about 2 million acres. These farms use nitrogen. How much nitrogen they use will depend on farming practices and the types of crops grown. Nitrogen gives you vegetative growth. If you put too much nitrogen fertilizer on your tomatoes, conventional wisdom goes, you’ll get plenty of leaves and very little fruit. A subset of data from 2005 (Table 1) shows a range in N requirements for different crops with an overall average suggested rate of 161 pounds of N per acre.
Synthetic N Math (annual demand):
- Multiply 27.6 million acres of farmland x 40% in crops = 11.04 million acres in crops
- Take an average N application of 161 pounds per acre — 161 lbs per acre/2000 lbs/ton = 0.08 tons of N per acre
- Multiply the total 11.04 million acres in crops x 0.08 tons of N per acre = a total demand for N of 888,720 tons of nitrogen needed annually
There are no precise records of fertilizer sales in the state but best estimates suggest that close to 700,000 tons of nitrogen fertilizer are purchased each year. There is also a lot of waste nitrogen produced each year. The two primary sources are people and cows. California has plenty of both. There are 39 million people in the state and 1.8 million dairy cows. People make waste nitrogen in the form of municipal biosolids and food scraps. Cows make cow pies or cow manure and urine. You think people make a lot of poop — each dairy cow makes about 7.8 wet tons or 1 dry ton of poop annually.
Waste N produced annually: We can do the same type of multiplication to figure out how much waste N is produced each year.
- Multiply 39 million people x 30 kg biosolids per person = 1.17 million dry tons of biosolids/year
- Biosolids are typically about 5% total N so 1.17 million tons x 0.05%N = 58,500 tons of N
- 39 million people x 50 kg food scraps per person = 1.95 million tons of food scraps. If we assign food scraps a value of 2% N, then: 1.95 million tons x 2% = 39,000 tons of N
- 1.8 million cows x 1 ton of cow poop = 1.8 million tons of cow poop. Cow poop is typically about 3% total N so 1.8 million tons x 0.03% N = 54,000 tons of N
- The N from the cows + the people = 151,500 tons of N. That is between 15-20% of the nitrogen needed by cropland. That is more than a dent. If you just consider the savings related to the energy costs to make the synthetic N, optimal use of residual N would save: 151,500 tons of N x 4 tons of CO2/ton of N = 606,000 tons of CO2 not generated. That is nothing to sneeze at.
Are We Optimizing Use Of Waste N?
The question is whether or not this “waste” N is being used to its fullest potential. I can’t speak for the cow manure but can say a thing or two about the human-based materials. Most of the food scraps are just now on their way out of landfills. California beneficially uses a majority of its biosolids but has to work really hard to do so. Many areas have outright bans on the materials. In other cases, using biosolids as alternative daily cover has counted as beneficial use (but this practice is no longer allowed under California’s SB 1383). It is not clear to me that you can expect much of a growth response from alternative daily cover. This suggests that for both biosolids and food scraps there is a lot of potential that has yet to be realized for these resources to be optimally used. One of the obstacles to broader and better use is the perception that there just isn’t enough land in California to absorb these materials. If my calculations didn’t convince you that this was a fallacy, it turns out that we can look at the scientific literature to drive home this point.
Scientific Literature “Drives” Home The Point
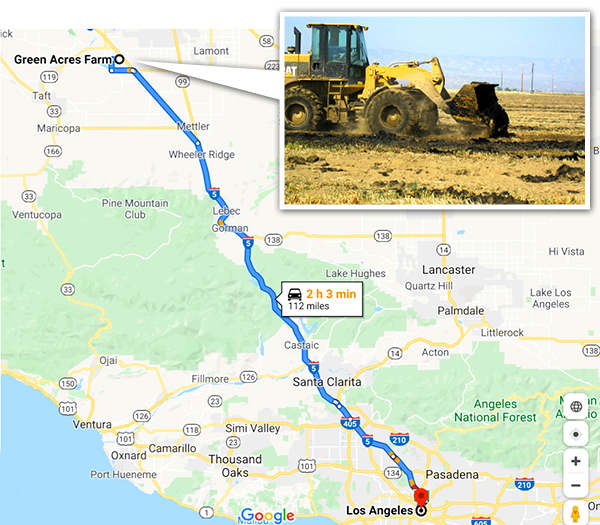
Green Acres Farm distance from Los Angeles – Map data ©2020 Google
Two recent studies have looked at the quantity of fertilizer in waste and whether there is enough land to accommodate it. Trimmer and Guest (2018) figured out how far nutrients from wastewater would have to travel to find farmland for cities around the world. Distance was a function of how big the city (the quantity of wastewater nutrients) was and how close farmland is to the city. Los Angeles was one of the cities included. They estimated that you would have to drive about 260 km (160 miles). That isn’t too far for a city of 4 million people. Los Angeles does drive a significant quantity of its biosolids to a farm in Kern County — Green Acres — where the cake has turned the dirt around. However, it has required multiple court battles and millions of dollars over multiple years (Figure 1) to keep that end use option viable. The people in Kern didn’t want any part of the cake from the big city. Partly as a result, the city is now injecting a portion of its biosolids deep underground where they suggest that it will make methane that can be harvested. There is room for improvement here. And plenty of acres that could use that improvement.
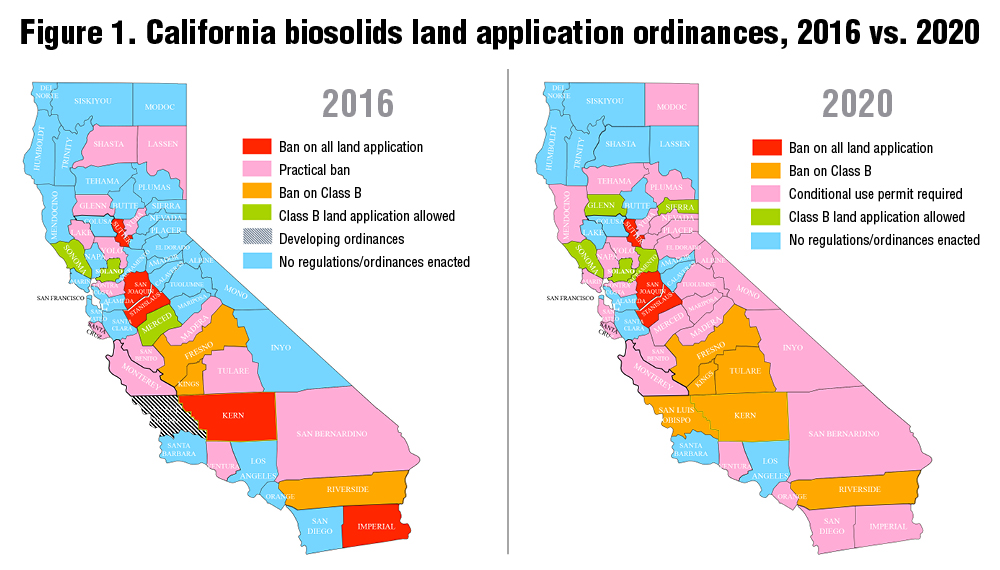
Another study focused on composts and digestates that will be made as a result of landfill diversion from California SB 1383. Harrison et al. (2020) mapped out how far compost would have to travel if all of the organics were diverted from landfills. They made the following determinations in their model:
- Composting facilities would be located in the middle of the city and that farmers would pay for the compost.
- Considered both farmland and grazing land. Urban end uses for compost were not included in their model.
- Considered emissions benefits from landfill diversion, soil carbon sequestration and fertilizer avoidance as benefits of using compost.
And about that carbon footprint related to driving cited as a compost market deterrent? Harrison et al calculated you would have to drive the finished compost about 11,0000 km before transport related emissions negated the benefits of the other factors. They figured that you couldn’t drive the compost more than 135 km and have it be cost-effective for farmers to use. No municipal subsidies were considered.
They also considered the impact of shorter driving distances on finding homes for the material. Here is what they found:
- 135 km Compost @ 9 tons ha-1 means you could apply compost to 805,000 ha or 6.42% of farmland each year
- 90 km Compost @ 9 tons ha-1 is pretty much the same as 135 km radius
- 45 km Compost @9 tons ha-1 would limit you to only applying compost to 664,000 ha or 5.29% of the farmland
The authors estimated that doing this would save about 6.3 MMT of CO2e annually. That is just from the compost. Can you imagine if you included the benefits from the biosolids and the cow manure? That takes those 4Rs from Drawdown and does them better just in California.
Like with every other benefit/end use of organics that we’ve looked at in this series the primary limitation to those benefits is that there just aren’t enough organics to go around. So let me ask you — why are we wasting any of them?
Sally Brown, BioCycle’s Senior Adviser and long-time Connections columnist, is a Research Professor in the College of the Environment at the University of Washington.
References
- Agricultural Issues Center. 2009. The Measure of California Agriculture. University of California.
- Charles, A., P. Rochette, J.K. Whalen, D.A. Angers, M.H. Chantigny and N. Bertrand. 2017. Global nitrous oxide emission factors from agricultural soils after addition of organic amendments: A meta-analysis. Ag. Ecosys. Environ. 236:88-98.
- Harrison, B.P., E. Chopra, R. Ryals, and J. E. Cambell. 2020. Quantifying the farmland application of compost to help meet California’s organic waste diversion law. Environ. Sci. Tech.
- Metson, G.S., G.K. MacDonald, D. Haberman, T. Nesme, and E.M. Bennett. 2016. Feeding the corn belt: opportunities for phosphorus recycling in U.S. agriculture. Sci. Total Environ. 542:1117-1126.
- Rosenstock, T.S., D. Liptzin, J. Six and T. P. Tomich. 2013. Nitrogen fertilizer use in California: Assessing the data, trends and a way forward. California Agriculture DOI: 10.3733/ca.E.v067n01p68
- Trimmer, J.T. and J.S. Guest. 2018. Recirculation of human- derived nutrients from cities to agriculture across six continents. Nature Sustain. 1:427-435.


