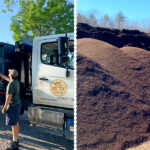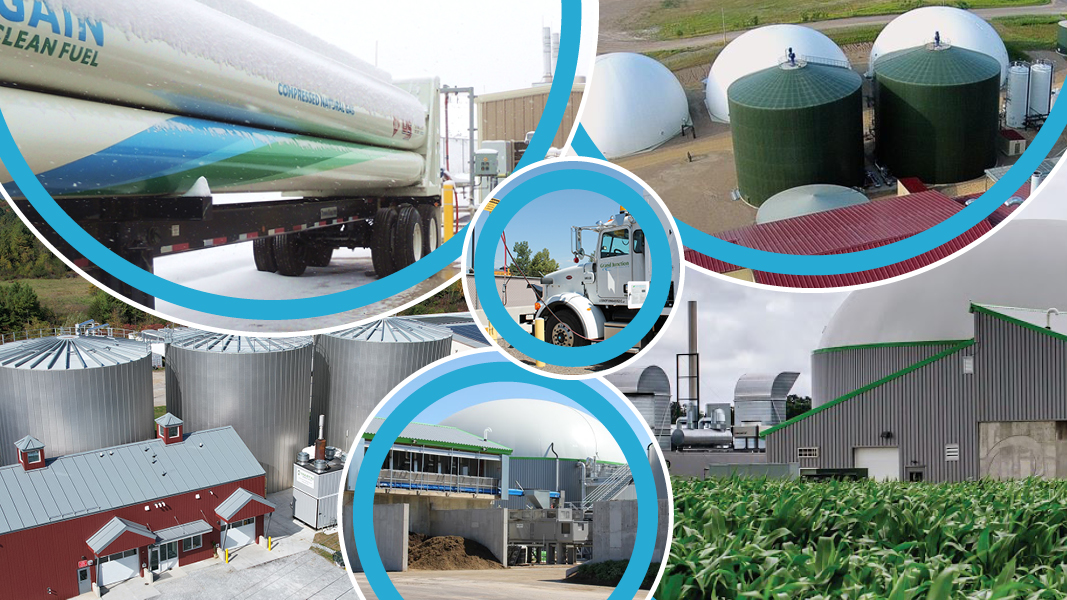
From top left to lower left, and center: Dane County (WI) biogas injection station; Hometown Biogas Energy (Le Sueur, MN); University of Wisconsin Rosendale farm digester; Purpose Energy food waste digester (Middlebury, VT) and in center, Grand Junction, CO RNG fueling station. Photos and graphics courtesy American Biogas Council and by Doug Pinkerton
Nora Goldstein
Of the 2,478 facilities in the U.S. that generate biogas, 47% (1,169) are anaerobic digesters at wastewater treatment plants, 25% (615) are on farms, 23% (580) are at landfills and 5% (113) are stand-alone food waste processors, reports the American Biogas Council (ABC), based on its 2024 data on the biogas industry. In terms of U.S. biogas production capacity in 2024, however, landfills generate 72% (979,697 standard cubic feet/minute (scfm), while wastewater treatment plants generate 170,480 scfm, or 12% of biogas production in the U.S. (Figure 1). Agriculture-based anaerobic digesters (AD) produce 13% of the country’s biogas, and stand-alone food waste digesters account for 3%.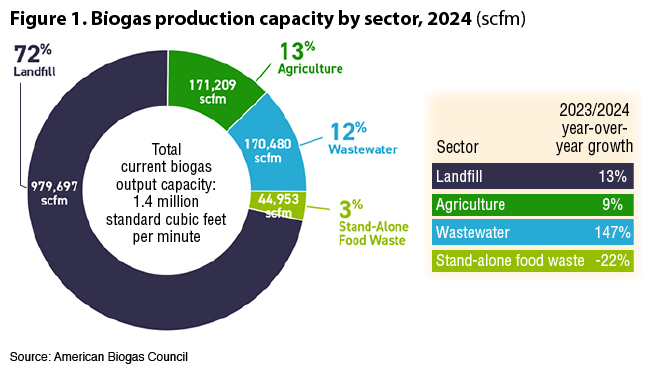
According to ABC, 2024 was “yet another record year for the industry. In the 12 months ending in December, 125 new biogas projects came online, representing over $3 billion in new U.S. investments. New projects in 2024 exceeded new projects in 2023 by 17%, while total investment in those projects increased by 40% compared to investment in projects opened in the previous year.” Added ABC Executive Director Patrick Serfass during a press briefing when the data was released, “the biogas industry is about 10% built out at this point. The potential exists for 24,000 new biogas systems, including 17,000 on farms, 4,000 at wastewater treatment plants (WWTP), 1,700 food-waste only facilities and 740 at landfills.”
Figure 2 illustrates the growth in what ABC calls “biogas capture facilities” from 2014 to 2024. Since 2014, there has been a 32% growth in biogas infrastructure. Of the 125 new projects, 24 are at landfills, bringing the total number of landfill gas (LFG) facilities in the U.S. to 580, an increase of 4.3% overall. The new LFG projects represent $1.4 billion in investment, says ABC, or 47% of the total capital that biogas developers invested in 2024 projects. In recent years, new LFG projects have been more likely to upgrade their biogas to RNG, but 77% of LFG projects overall produce electricity.
The agriculture sector led in new biogas projects starting up in 2024, growing by almost 18% and surpassing the total landfill gas projects for the first time ever, according to the ABC data. The increase from 522 in 2023 to 615 total projects in 2024 represents $1.39 billion in capital investment (mostly in rural communities) and 21,000 scfm of additional biogas output. More hog farms came online than in previous years, adding 29 facilities, or 31% of all new farm projects. The dairy sector continues to represent the largest piece of the farm-based biogas pie at 85.9% (Figure 3).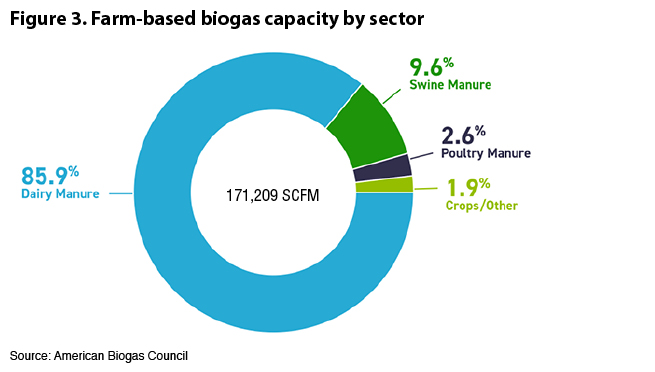
Biogas projects operate in every U.S. state, says ABC, adding that “with the growth in agriculture projects in 2023 and 2024, many agriculture-heavy states have attracted the most local investments. The location of yet untapped landfills also drives the location of capital invested. In 2024, California ($346.2 million), Illinois ($267 million), South Dakota ($264.5 million), Pennsylvania ($260 million) and Virginia ($253 million) saw the most dollars invested, based on projects that came online. In 2023, the five states that saw the most capex come online were Michigan, Indiana, Virginia, Ohio, and Texas.”
Stand-Alone Food Waste Digesters
ABC reports that food waste-only AD systems are the least numerous, “likely because they’re the most complex.” The sector added three new projects in 2024, bringing the total to 113. Of those, 47 receive postconsumer food waste, 37 take preconsumer industrial food waste and wastewater, and 29 take beverage and distillery waste.
Separately, about 200 agriculture and wastewater AD biogas facilities in the U.S. take in food waste and anaerobically digest it along with manure or wastewater biosolids. According to ABC’s ongoing research, “up to 3% of all postconsumer food waste is recycled by 70 farm-based AD facilities which are supplementing their manure feedstock with a yearly average of 31,200 tons of food waste per facility,” notes Ian Taylor, ABC’s Data & Analysis Manager. “WWTPs are another important destination for food waste. So far, we have identified that almost a third of the 1,091 WWTPs with operational biogas systems are accepting food waste today. At these facilities, the food waste is primarily in the form of FOG (fats, oil, and grease).”
Capital Investment
ABC’s data captures capital investments in the four primary biogas sectors it tracks. It reports that about $15.5 billion have been invested in the wastewater sector, $14.1 billion in the LFG sector, $5.6 billion in the agricultural sector and $2.2 billion in the food waste digestion sector. During the press briefing, Serfass explained that capital invested at WWTPs is primarily for adding anaerobic digestion capacity to the plants, or for expansion of existing AD infrastructure.
Of the 125 new biogas projects that came online in 2024, 119 (95%) were built to upgrade their biogas to renewable natural gas (RNG). Figure 4 illustrates new capital investment in 2024 on a MMBtu (metric million British Thermal unit) basis, which reflects the RNG production capacity installed. The biggest cost/MMBtu is in the wastewater biogas sector ($195/MMBtu) while the lowest is in the landfill sector ($24/MMBtu).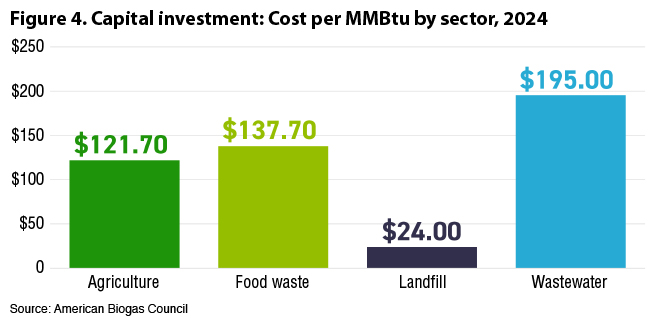
Power Vs. RNG
Despite the fact that 95% of new biogas project that came on line in 2024 produce RNG, the vast majority — 77% — of facilities utilize the biogas to produce electricity (Figure 5). “This dominance of RNG in new projects has existed since about 2018, spurred by California’s Low Carbon Fuel Standard (LCFS) program and the federal Renewable Fuel Standard (RFS), which reward renewable fuel producers who reduce transportation emissions and air pollution,” explains Serfass. “The latest data reflects the fact that much more revenue can be earned selling biogas as RNG than power. However, while RNG is the growth sector, 60% of total biogas output goes to make renewable power, a fact that surprises many with the recent focus on RNG.”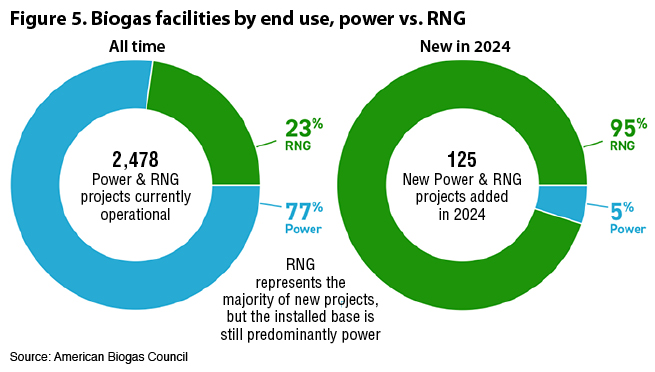
Figure 6 shows 2024 RNG output capacity by sector. Out of a total current annual RNG output capacity of 159 million MMBtu/year, 67% is represented by the landfill sector, 26% by the agricultural sector, 4% from wastewater and 3% from stand-alone food waste digesters.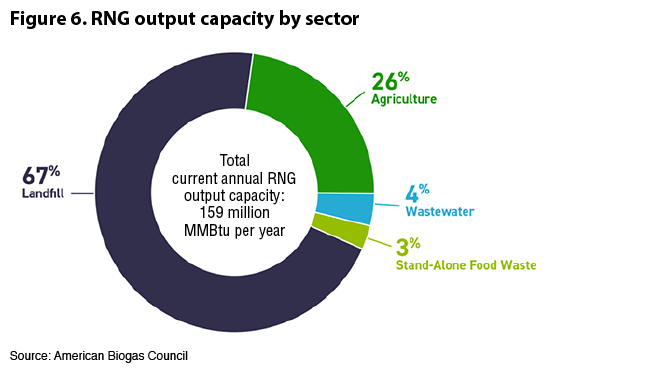
One major component of anaerobic digestion facilities that is not reflected in the ABC data is digestate. “Our research is looking at how AD facilities are managing their digestate, but at this stage it is too early to say much definitively,” says Taylor. “So far, we only have results for about a third of facilities. End uses include land application and sale of commercial soil ‘improver’. At this point, ABC’s data primarily focuses on biogas capture and end uses, along with capital investments in biogas infrastructure as is reflected in our 2025 data release.”