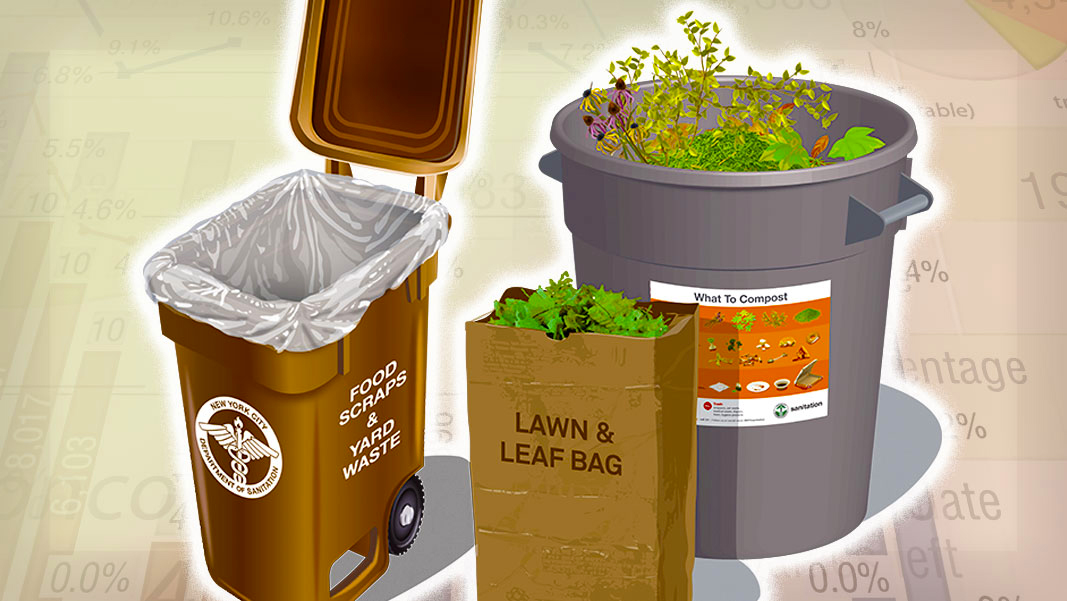
Top: Image courtesy New York City Department Of Sanitation
Samantha MacBride
As current crises of climate change, food insecurity, and soil depletion escalate, many U.S. localities have started to offer curbside collections of organics (including food scraps, yard trimmings, and compostable paper and packaging). A lot of potentially valuable material is at play. Nationally, at least 73.5 million tons of organics are disposed each year, two-thirds of which are food scraps (U.S. EPA, 2020). In 2018, about 25% of all recoverable organics were beneficially used, although this rate was far higher for yard trimmings (63%) than for food scraps (4%). This trend is seen in municipal-scale programs as well.
To improve organics diversion, localities need better performance analytics. The organics capture rate is the best metric for this job. Using New York City as a case study will show how important capture rates are for accurate agency performance-monitoring and policy development. If we want to make real, and not rhetorical progress in preventing large scale wasting of organics, we need to be honest about capture rates.
What Is The Organics Capture Rate?
The diversion rate assesses the total tonnage of MSW that is kept out of disposal and sent to beneficial use. The capture rate goes further: it is specific to materials, or groups of materials, as opposed to waste flows in total. Three basic ingredients are needed to calculate an organics capture rate: organics tonnages, refuse tonnages, and waste composition percentages. Tonnages of collected organics that people have dutifully separated and set out for collection are in the numerator. The denominator has that same tonnage, plus an estimate of the unseparated organics that people leave, incorrectly, in the trash. Figure 1 illustrates the formula.
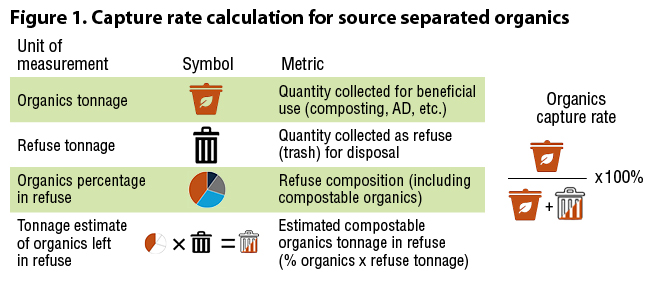
Some municipalities subtract contamination from the organics tonnage, which lowers calculated rates. This step is useful, but for trend analysis not strictly necessary. To calculate capture rates for subcategories of organics, like food scraps or yard trimmings, data is required on organics composition as well as refuse composition.
The capture rate assesses how much actually is being collected for beneficial use, vs. how much could be if everyone did what they were supposed to. A 5% annual capture rate shows the rate at which organics are making their way to composting, anaerobic digestion, or other treatments, with the remaining 95% still disposed in landfills or combusted. In any locality, a 5% capture rate would be considered low, poor performance. For contrast, consider Seattle’s curbside organics capture rate of 60% (City of Seattle, 2022, 2023, 2024), or New York City’s (NYC) recycling capture rate of nearly 50% (NYC Dept. of Sanitation (DSNY), 2024a). It should be noted that despite its overall excellence in openness, transparency and accountability, the City of Seattle does not publicize organics capture rates. It does, however, share tonnage and waste characterization data, which enables calculation of the capture rate (see references for links).
As waste metrics go, capture rates are natural “b.s.” detectors because they look at performance in terms of real-world material potential, as opposed to abstract goal setting, or out-of-context celebration. Capture rates can and should be calculated for different organics programs within a locality, because organics are generated, separated, contained, set out, picked up, transferred and transported to beneficial use under many different sets of arrangements. Programs for commercial yard trimmings, for instance, involve different individual, institutional, public, and private sector responsibilities than do residential programs for commingled compostables. A program-specific capture rate is as close as we get to measuring the performance of those diversion efforts.
Case Study: NYC Residential Curbside Organics Capture Rates
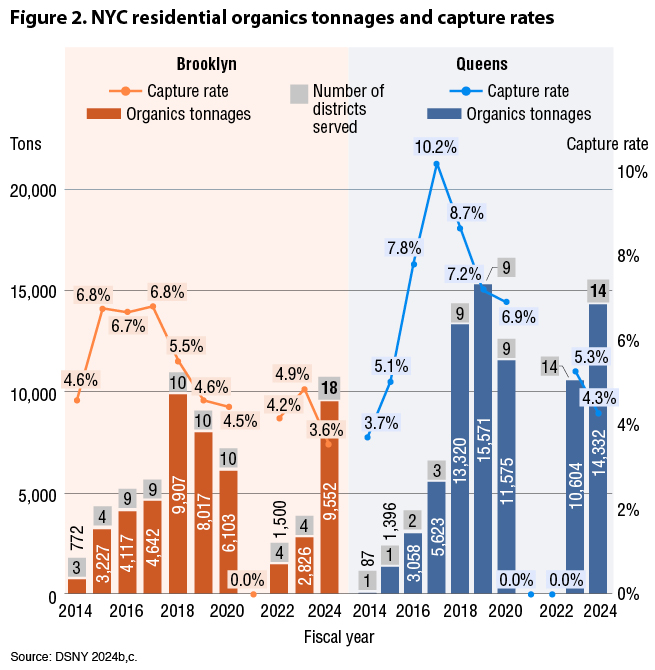
NYC’s reintroduced residential curbside organics program began in Queens in October 2022 and expanded to Brooklyn in October 2023. (Data on program performance in Queens is in this March 2024 BioCycle article by the author.) Both boroughs had experience with a previous program from FY2014 to FY2020, though service was limited to certain districts, and extended only to 1- to 9-unit buildings. The new program offers universal collection across all 18 Brooklyn and 14 Queens districts, regardless of building size. However, despite this broader reach, total tonnages collected and capture rates have declined, as shown in Figure 2. In FY2018, Brooklyn collected more organics from 315,000 households in 10 districts than from over 1 million households across all 18 districts in FY2024. Similarly, Queens collected more in FY2019 from 380,000 households in 9 districts than from nearly 900,000 households in all 14 districts in FY2024.
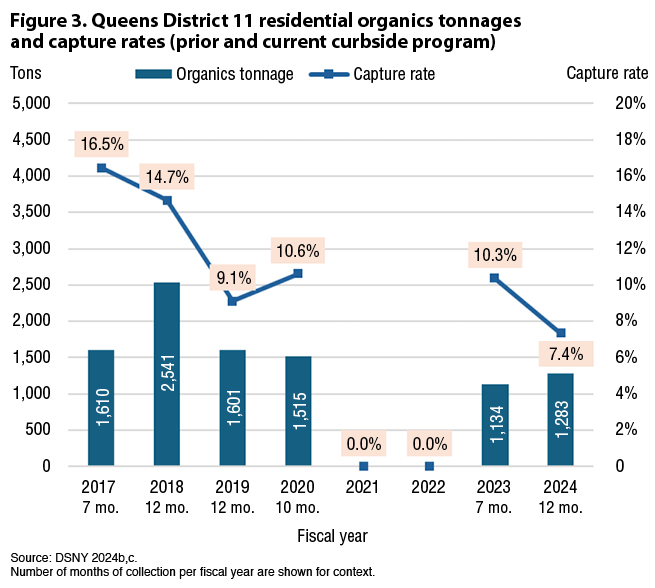
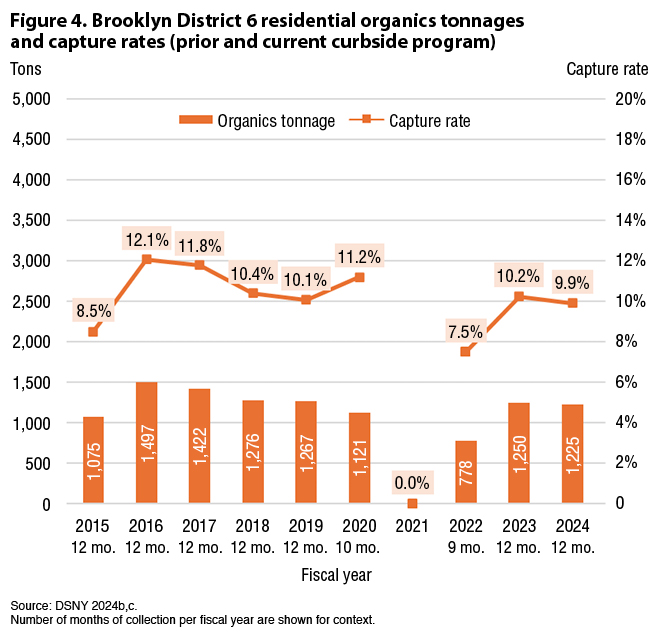
These trends are consistent at the district level. Few districts, past or present, have reached double-digit capture rates. Queens District 11, a suburban area, was a high achiever with a 16.5% capture rate in FY2017, but by FY2024, its rate had dropped to 7.4%, reflecting overall decline even in higher performing areas (Figure 3). A more urban high achiever is Brooklyn 6, which hit a high of 12.1% capture in FY2016. This district has consistently shown the highest curbside dual-stream recycling rates (both capture and diversion) over the decades. In fact, it was selected for the City’s earliest residential curbside organics pilots in the 1990s, which were cancelled due to low tonnages and high collection costs (Citizens Budget Commission, 2016). As of FY2024, its capture rate had dropped somewhat to 9.9% (Figure 4).
In other districts, achievements are lower. For example, Queens District 4, a densely populated area with predominantly multifamily housing that is new to curbside organics, has yet to reach a 2% annual capture rate (currently at 1.5%). Brooklyn District 1, despite having more experience, shows equally low results (1.7% in FY2024). More details are available in a companion document to this article that has supplementary figures and tables for NYC’s organics capture rate. The methodology used by the author is included. They show that no matter how you slice it, organics capture rates are low and getting lower.
Analyzing Subcategories Of Organics
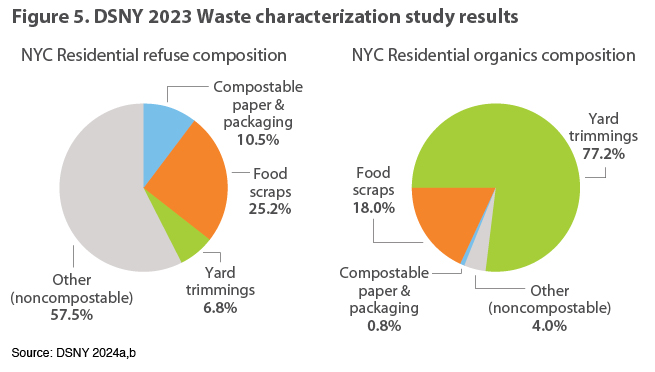
A review of the NYC’s latest waste characterization data shows that food scraps dominate residential refuse, and have a capture rate lower than the citywide average for organics as a whole. Figure 5 compares the citywide residential refuse stream (left) with the citywide organics stream specifically (right). The refuse composition chart on the left shows that nearly 43% of the refuse stream is compostable, with food scraps (25.2%) and compostable paper and packaging (10.5%) making up most of this portion. Yard trimmings contribute another 6.8% to the overall organics in refuse total. The remaining 57.5% of refuse consists of materials unsuitable for curbside composting (DSNY 2024a,b). The residential curbside organics stream (chart on the right) has a much higher concentration of yard trimmings (77.2%) than food scraps (18.0%), with almost no compostable paper/packaging, and a low contamination rate of 4%.
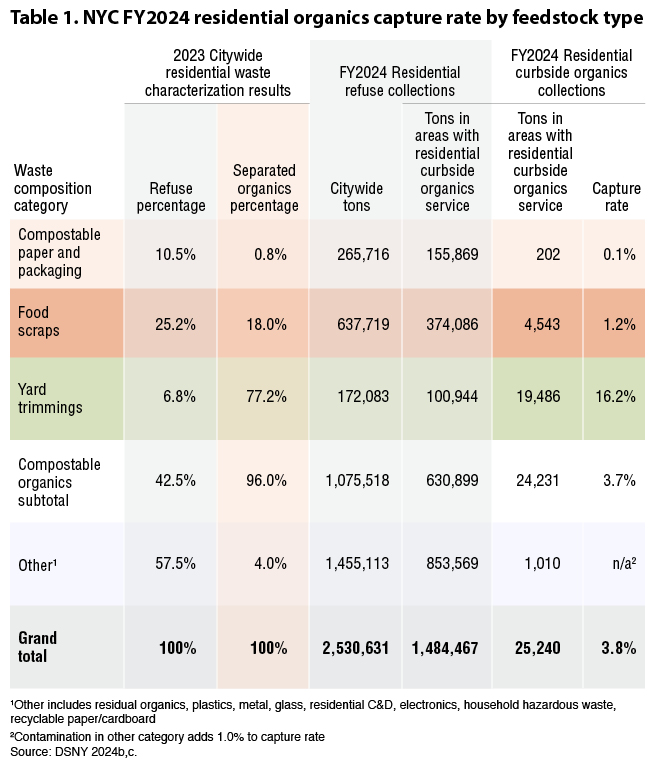
Calculating the capture rate in areas currently served by curbside organics collection shows that while the citywide capture rate for organics was 3.7% in FY2024, yard trimmings had a higher capture rate of 16.2% (Table 1). In contrast, food scraps showed a very low rate of 1.2%, and compostable paper/packaging rates are essentially zero. Borough and district-level capture rates for subcategories cannot be calculated, because the DSNY only reports residential organics composition at a citywide level.
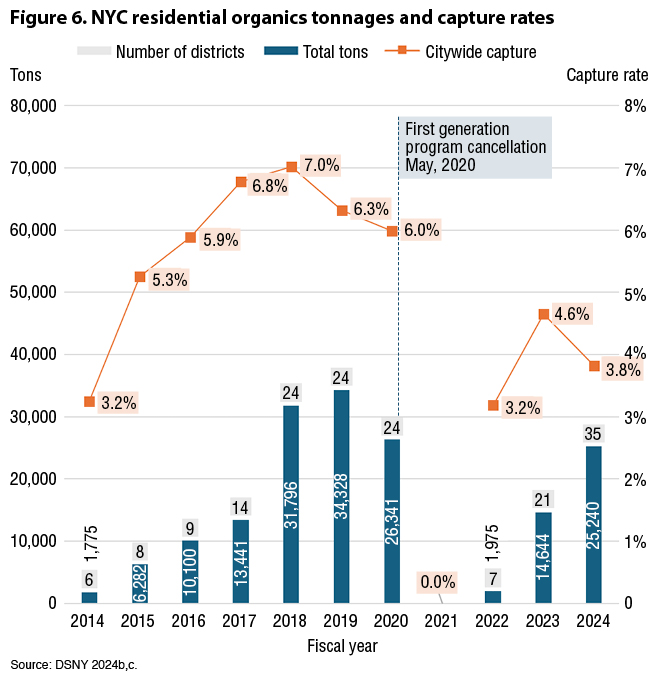
Citywide Implications
I began looking at organics capture rates because I knew that the performance of New York City’s prior residential organics program had been dangerously low. The abysmal capture rate, reflecting low-efficiency/high-cost collections, ultimately doomed NYC’s effort, leading to program cancellation for that reason (Figure 6). While the COVID pandemic accelerated cancellation in May 2020, the lackluster achievements of the prior program would have led, sooner or later, to the same outcome. The first hints came at the start of FY2019, when then Mayor de Blasio paused expansion of the program into new districts, citing inefficiencies. Later that year, a residential curbside organics tonnage record was set with over 34,000 tons collected, yet over one million tons of compostable organics were trashed, despite the existence of costly programs to divert them.
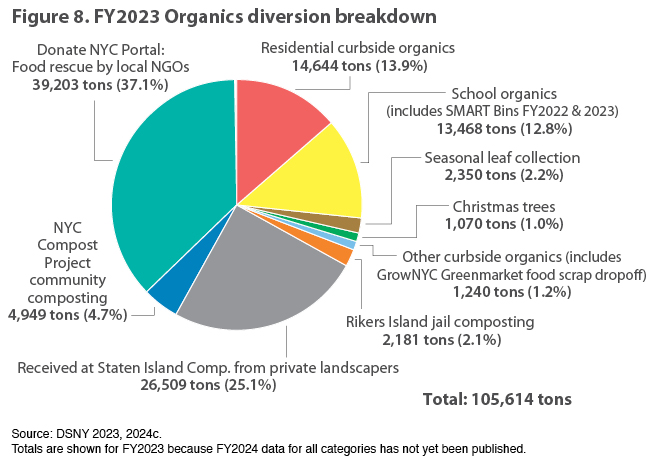
This massively wasteful situation still holds strong today (Figure 7). If you feel like you’re looking at a thin layer of compost icing atop a decomposing cake made of landfilled organics, you’re right. Progress on organics diversion over the last 10 years has been tiny and constantly under threat of cancellation. Despite this, in February 2024, DSNY began reporting that its new organics program was “breaking all past records” of success, having achieved an unprecedented 105,000 tons of diversion in FY2023 (Goodman, 2024). Figures to back up these claims were reported as lump sum tonnages in an annual, mayoral summary of performance metrics. These tonnages, which appeared to rise starting in FY2020, made it seem as if there had been substantial annual progress in organics collections, leading to, as the report stated, “the highest rate of composting in the City’s recent history” (City of New York, Mayor Eric L. Adams. 2023). But there was more to the story.

Cross-checking the totals against DSNY tonnage and diversion reports that went into greater detail confirmed that most of the claimed totals, past and present, were from programs that were neither new to the Adams administration, nor related to curbside organics (DSNY 2023). In FY2023 (Figure 8), this included nearly 40,000 tons of rescued food donations brokered by nongovernmental organizations, and another 26,500 tons of private sector landscaper organics dropped at DSNY composting facilities. The remainder included community composting, on-site composting at the Rikers Island jail complex, and supplemental seasonal pickups. Out of the 105,000 tons total, 14,600 tons were from weekly curbside collections of organics from residents, and 13,500 tons from SMART Bins (residential food scraps drop-off containers) and schools combined.
While food rescue, landscaper composting, and community/institutional programs are valuable, they don’t involve use of DSNY collection labor, fuel, or equipment. They are not comparable to curbside residential organics programs that feature high costs for weekly collections, and require participation by millions of households. While there is nothing wrong with summing up different categories of organics diversion for reporting, the differences among categories need to be clearly identified to avoid misattributing curbside achievements to non-curbside endeavors outside the residential sector.
Misattribution causes confusion and gets in the way of accountability. In March 2024 NYC City Council hearings, the DSNY Commissioner Jessica Tisch reported diverting “211 million pounds (105,000 tons) of compostable material from landfill,” adding that “this is a testament to the value of simple, universal programs…[and is] the highest diversion number ever in the department and it makes sense because we finally have citywide programs that actually work and are thoughtful” (Tisch March 2024, emphasis added). In a May 2024 City Council hearing, the DSNY commissioner similarly declared: “As the largest and easiest curbside composting program ever, one of the great things about it is that it does some of its own outreach, right? The program is so much easier to use that basically the message is so much simpler than it’s been in the past. Set it out every week on your recycling day, use whatever bin you want, anything from your kitchen, anything from your garden, no signup, no opt in, no complicated rules, no restrictions, no special day, no limited hours, right?” (Tisch, May 2024,emphasis added).
Statements such as these give the impression that the 105,000 total diversion figure tonnage reflects new, easy, universal organics programs for residents. But only 14,600 out of 105,000 total tons came from residential curbside collections, where the program’s simplicity would have shown its results. Measured capture rates strongly suggest that the current curbside organics program is not doing its own outreach, possibly because it is not much simpler than its prior, pre-2021 version. Under that program, residents of buildings of 1- to 9-units could also “set it out every week on your recycling day…[and include] anything from your kitchen…anything from your garden…no sign up, no opt in,” with no complicated rules beyond the fact that the DSNY-issued brown bin had to be used, and no restrictions, special day or limited hours.
The takeaway from a citywide capture rate analysis is clear: capture rates tell us what is actually happening. The low capture rates reported in this article do not reflect the fact that the program isn’t yet extended citywide because these rates were calculated only for areas currently served with residential curbside organics collection. The program expanded to the rest of NYC this month (October 2024), which may lead to modest tonnage increases. But capture rates won’t increase unless there is a major shift in participation across all boroughs. Simple expansion of residential curbside collection to the remaining boroughs is not a solution on its own.
Current low capture rates in Brooklyn and Queens challenge the assumption that program simplicity is a participation game changer. If anything, capture rates are lower than under prior, supposedly more complicated, program arrangements of the past. Claiming success in school organics diversion is also not a solution, because of the far smaller size of this waste stream in comparison to residential sources. There is serious work to be done to raise capture rates, and divert meaningful tonnages from disposal.
Municipal Organics Program Recommendations
These observations lead to recommendations for any city aiming to improve organics diversion. First, datasets for program-specific capture rates (e.g., separated organics tonnage, refuse tonnage, and refuse/organics composition) should be freely accessible, allowing all stakeholders to benefit from the insights. Disaggregated data is preferable, with program-specific tonnages and composition statistics for commercial, residential, school, and other collection programs.
For cost-benefit analysis, data should distinguish between truck collection and on-site/drop-off methods, with further disaggregation where locally relevant. For example, Seattle reports commercial, single-family, and multi-family refuse and organics separately because its haulers collect these streams on different routes. In cities where streams are collected together (e.g., commercial and multi-family, or schools and city agencies), official estimates from waste characterization studies can substitute split estimates for separately measured tonnages.
Second, there is a clear need to apply well-established methodologies for program evaluation to assess outcomes of different, future interventions to improve performance. Such inquires involve quasi-experimental designs, designating some municipal areas as control groups and others as test cases where combinations of interventions are tried out (Cham, et al., 2024). For this, the capture rate is a perfect dependent variable against which to evaluate the effect of different programmatic approaches.
Overall, cities should not fear reporting capture rates publicly. Organics diversion programs require a sea change in generator behavior as well as institutional operations. They are tough to implement, and feedback is essential. If an approach is not working, it’s best to confront this head on so that we can make way for something better. In the waste world, it’s common to say “what can be measured can be managed.” In fact, we have been measuring waste streams since the 19th century. In 1897, NYC sanitation commissioner George Waring reported nearly 1.4 million tons of residential waste collected, lamenting that only a small portion was separated for processing into what we’d call “bioproducts” today (Waring, 1897; Zimring, et al, 2021; Miller, 2000). In 1905, NYC published its first waste characterization study, quantifying organics — then known as garbage — as 13% of a waste stream whose other components included rubbish (27%) and ash (80%) (Walsh. 2002.) Some 120 years later, it is time to use real performance analytics to drive real research, evaluation, and public engagement to achieve change.
Samantha MacBride, PhD, teaches urban environmentalism, public management and program evaluation at Baruch College’s Marxe School of Public and International Affairs, and worked on the New York City Department of Sanitation’s curbside recycling and organics programs for over two decades. She retired from the New York City Department of Environmental Protection’s Bureau of Wastewater Treatment, where she managed process engineering research, development and training. She is currently pro bono Advisor to Earth Matter, a leading organization in community composting.