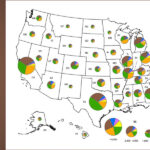
Latest national data on municipal solid waste management – 29 percent recycled and composted, 7 percent combusted via waste-to-energy and 64 percent landfilled. (A joint study by BioCycle and theEarth Engineering Center of Columbia University)
Ljupka Arsova, Rob van Haaren, Nora Goldstein, Scott M. Kaufman and Nickolas J. Themelis
THE STATE of Garbage In America Report was launched by BioCycle in 1989. State of Garbage In America provides a picture of how municipal solid waste (MSW) is handled throughout the United States. This is the 16th nationwide survey. Starting with the 2004 State of Garbage In America survey, BioCycle began collaborating with Columbia University’s Earth Engineering Center (EEC), which developed a new methodology for data collection.
The 2008 State of Garbage in America survey, conducted over the winter and spring of 2008, collected and reports on calendar year 2006 data provided by individual states (where available). For this report, BioCycle and EEC engaged the services of Emerge Knowledge Design, Inc. to create an on-line form used by states to enter their data.
The information in this article is the culmination of the third BioCycle/EEC collaboration, conducted by the authors of this report using 2006 data. The national picture of the State of Garbage in America is: Of an estimated total of 413 million tons of MSW generated, 28.6 percent is recycled and composted, 6.9 percent is combusted in waste-to-energy plants and 64.5 percent is landfilled. The invaluable contributions of the state solid waste and recycling officials providing data are most appreciated.
STATE OF GARBAGE METHODOLOGY
Prior to BioCycle’s collaboration with EEC, the State of Garbage questionnaire asked states to provide the annual tons of MSW generated and a percent breakdown of tons recycled, composted, combusted and landfilled. The tonnages of MSW recycled, combusted and landfilled were calculated using the percentage breakdowns and MSW generation tons for each state. Those tonnages (based on weighted averages) were used to calculate the national rates for recycling, combustion and landfilling (see years 1988-2000 in Table 1).
The EEC methodology is a more objective, numbers-based analysis of solid waste management in the U.S. In the 2004 State of Garbage in America survey (the first using the new methodology), therefore, all data were requested in actual tonnages. For instance, instead of asking states what percent of the total MSW generated was landfilled, the survey questionnaire asked for the tons landfilled in each category listed (e.g., residential, commercial, industrial, C&D, organics, tires). If such a breakdown was not available, we asked for total tons landfilled. The same was done with recycling data: specific tonnages recycled were requested, broken down by categories (e.g., glass, metal, paper).
To maximize the opportunity for direct comparisons (state by state and nationally), the next step is to calculate the MSW-only portion of total solid waste generated, recycled, combusted and landfilled. This is accomplished by including only MSW stream tonnages, i.e., the residential and commercial waste streams, organics and tires. It does not include C&D, industrial and agricultural waste.
MSW that crosses state lines is attributed to the state of origin; imported waste is excluded from state MSW totals while exported waste is included. Recyclables include tons reported for glass, steel, aluminum, other metals, paper, plastic, tires, organics, wood and “other.” C&D materials and industrial wastes (e.g., automobile scrap) are not included. The estimated tonnage of MSW generated in a state consists of the sum of tons recycled and composted, combusted in WTE facilities, and landfilled.
DATA CHALLENGES
While many recycling and composting programs were initiated with funds from state government, their management has always been at the local level. In some states, reporting of tonnages diverted from disposal was required in order to receive additional grant funds and calculate how a state was progressing to meet its recycling goal. In other states, this type of reporting was not required. Furthermore, states differed on what they counted toward their recycling goals, e.g., some included C&D debris while others did not (which is still the case today).
Over time, the private sector invested in collection and materials processing. This presented challenges in collecting information on final tonnages recycled due to the competitive nature of the industry. In some states, reporting mechanisms were established to track these recycled tons.
This lack of consistent reporting methods (from state to state and nationally) of recycled and composted tons was factored into the EEC’s development of the State of Garbage methodology by asking states to break out all the waste streams included in their reported tons recycled/composted, combusted and landfilled. As has been found each year the State of Garbage survey has been conducted, the in-state landfilled and combusted tonnages are reported with near certainty, owing to the fact that landfills and WTE facilities are generally permitted with regulatory reporting requirements.
Recycling and yard trimmings composting facilities, on the other hand, are not necessarily required to report throughput. Therefore, some states reported estimates of their recycled or composted tons based on historical data or waste composition studies, while some did not report these categories at all.
In this year’s survey, as was the case in previous years, the State of Garbage team corresponded with state solid waste and recycling staff to clarify the data submitted, primarily to distinguish MSW tons from non-MSW tons reported. When necessary, data gaps were also filled in, or “back calculated,” through the use of historic State of Garbage recycling rates applied to the known tonnage disposed from 2006.
The majority of states in the 2008 State of Garbage In America survey provided 2006 data, as requested. Footnotes in the tables indicate the year of the data if other than 2006. Alabama is the only state not providing any data for this year’s report. Therefore, the state was assigned values based on average per capita recycling and landfilling of the reporting states.
There are some notable changes in how data is reported in 2008. First, BioCycle/EEC decided to eliminate the calculation of a national “Reported MSW Generation” tonnage (Table 1) as that data was not provided by all 50 states. Table 2 includes the reported tonnages that were provided.
Second, the State of Garbage team chose not to calculate the percent of MSW recycled/composted, combusted via WTE and landfilled for individual states. Instead, only the national percents were calculated. Third, insufficient data was provided to include total number of curbside recycling programs and yard trimmings composting facilities in the U.S. Additional data collection is needed in order to present national totals.
THE NATIONAL PICTURE
The 2008 State of Garbage in America survey estimates that a total of 413,014,732 tons of municipal solid waste were generated in the United States (all 50 states and the District of Columbia) in 2006. Estimated MSW generated includes MSW recycled/ composted, combusted at WTE facilities and landfilled. Reported tonnages were adjusted to exclude non-MSW such as construction and demolition debris and industrial waste.
The 413 million tons reflects a 25 million ton increase in MSW generation between the 2006 and 2008 State of Garbage surveys. The per capita estimated generation is 1.38 tons/person/year, higher than the 1.3 tons/person reported in 2006. At the same time, the percent breakout between tons recycled/composted, combusted and landfills is almost identical – 28.6 percent (2008) versus 28.5 percent (2006) recycled; 6.9 percent (2008) versus 7.4 percent (2006) combusted; and 64.5 percent (2008) versus 64.1 percent (2006) landfilled.
Table 3 provides the “raw” tonnages for each state used to calculate the national percentages. The per capita MSW generation rate is also provided for each state, along with their 2006 population. According to our State of Garbage calculations, Idaho has the lowest per capita MSW generation (.85), followed by North Carolina (.93), Connecticut (.96) and New Hampshire (.97). At the other end of the spectrum, the highest per capita tonnages were found in Indiana (2.5), Illinois, (2.07) and Tennessee (2.01).
Table 4 reports the tons of MSW imported and exported for landfilling and combustion in the United States in 2006. Tonnages were reported by 38 states. A total of 35.9 million tons were imported, and 25.4 million tons were exported. Pennsylvania receives the largest amount of MSW from other states (7.3 million tons), followed by Michigan (6.3 million tons), Ohio (3.8 million tons), Indiana (2.2 million tons) and New York (2.1 million tons). States exporting the greatest tonnages are New York (4.5 million tons), Maryland (2.9 million tons), New Jersey (2.6 million tons), Missouri (2.5 million tons) and Illinois (2.4 million tons).
LANDFILLS AND WASTE-TO-ENERGY
Table 5 provides state-by-state information on landfills and WTE facilities. According to this year’s State of Garbage In America report, the number of MSW landfills in the U.S. actually increased between 2004 and 2006. This year’s total is 1,831 landfills (44 states reporting), compared to 1,654 landfills two years ago (45 states reporting). The average landfill tip fee nationally was calculated to be $42.08/ton, with average tip fees in the states ranging from $15/ton in Oklahoma to $96/ton in Vermont.
States estimated total remaining landfill capacity, reporting in either cubic yards or tons. Pennsylvania reported that it has 265 million tons of remaining capacity, followed closely by Virginia (249 million tons) and Kentucky (212 million tons). Each of those states noted that landfill capacity is still being added. Several states reported landfill capacity remaining by the number of years. Mississippi has 817 years of capacity left, while Utah has 200 years.
On the combustion side, there are 103 WTE plants in the U.S., with a national average tipping fee of $64.88/ton. Florida and New York report the most plants (11 and 10, respectively); Maryland and Minnesota each have 9 plants. Reported tipping fees range from $52/ton at North Carolina’s one WTE facility, to $98/ton in Washington State.
THE RECYCLING SCENE
The amount of MSW recycled in 2006 is an estimated 118 million tons. Only 33 of the 50 states, and the District of Columbia, were able to provide recycled tonnage data for calendar year 2006. Six states reported 2005 tonnages; 3 states provided 2004 data, 1 had 2003 data, and the State of Garbage team used calculated recycled tonnages from the last survey (2004 data) for 6 states. Alabama did not report.
Table 6 lists the quantities of specific materials recycled by 27 states. Fairly high tonnages of paper were reported recycled, along with organics that include yard trimmings, wood and food waste.
DISPOSAL BANS
States are asked to list all MSW materials banned from landfill disposal. Information was gathered for 43 states (Table 7). Lead-acid batteries and whole tires are the most commonly banned materials. There are 23 states that ban all, or a portion of, yard trimmings from disposal. Pennsylvania, for example, bans “truckloads comprised primarily of leaves;” Connecticut only bans grass clippings.
West Virginia, at the state level, bans yard trimmings from disposal, but notes that if a composting facility isn’t available, the local landfill can usually get a waiver. In some situations, states do not have a ban on yard trimmings, but one may be adopted by a local government. For example, Santa Cruz County in California has a landfill ban on recyclable materials at two of its landfills. The same materials, which include yard trimmings, can be recycled at those landfills.
A follow-up article will provide a more detailed analysis of the information reported by states for the 2008 State of Garbage In America survey. A summary of the data that was provided to BioCycle and EEC, but not reported in this article, will be included.
Ljupka Arsova and Rob van Haaren are Junior Research Associates with the Earth Engineering Center (EEC), Department of Earth and Environmental Engineering, at Columbia University. Nora Goldstein is Executive Editor of BioCycle. Scott Kaufman recently received his Ph.D. in Earth and Environmental Engineering at Columbia University. Nickolas J. Themelis is Director of the EEC and Stanley-Thompson Professor, Earth and Environmental Engineering, at Columbia University. The authors acknowledge the contribution of Christopher Yee.


